Azure IoT Central - Fully managed hosted platform to build and run your IoT Solutions at scale
Azure IoT Central is a fully managed hosted IoT platform that makes it easy to connect, monitor, and manage your IoT assets at scale. Bring your IoT solutions to market faster while staying focused on the business problem and your customers.
- Simplify setting up your IoT solution
- Connect and manage your things with ease
- Rest easy with world-class security and privacy
In this workshop, you will learn how to build, use and administer an IoT Central application with the help of the following tutorials:
- Tutorial 1 - Create an application
- Tutorial 2 - Create a new custom device template
- Tutorial 3 - Connect MXChip Device to IoT Central
- Tutorial 4 - Configure rules and actions for your device
- Tutorial 5 - Administer Your Application
Scenario
Contoso company makes Connected Air Conditioners with following device profile that they need to remotely monitor and trigger alerts when something goes wrong:
- Sends telemetry such as temperature.
- Reports device state such as ON or OFF.
- Has properties such as firmware version and serial number.
- Has settings such to configure target temperature and fan speed.
Tutorial: Create an application
Navigate to the Azure IoT Central Application Manager page (https://aka.ms/iotcentral). You will need to sign in with a Microsoft personal or work or school account.
To start creating a new Azure IoT Central application, select New Application. This takes you to the Create Application page.
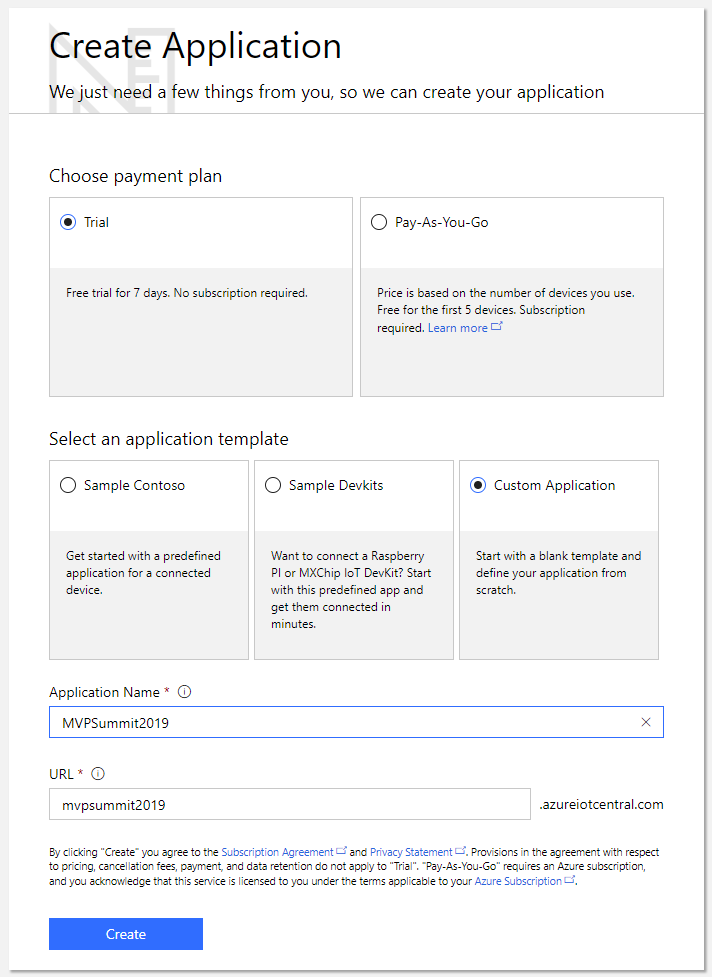
To create a new Azure IoT Central application:
- Choose a payment plan:
- Trial applications are free for 7 days before they expire. They can be converted to Pay-As-You-Go at any time before they expire.
- Pay-As-You-Go applications are charged per device, with the first 5 devices free. If you are creating a Pay-As-You-Go application, you need to select your Directory, Azure Subscription, and Region.
-
Choose a friendly application name, such as Contoso IoT. Azure IoT Central generates a unique URL prefix for you. You can change this URL prefix to something more memorable.
-
Choose Custom application as the application template.
- Select Create.
Tutorial: Create a new device template
As a builder, you can create and edit the device templates in your application. When you create a device template, Azure IoT Central generates a simulated device from the template. The simulated device generates telemetry that enables you to test the behavior of your application before you connect a real device.
The following steps show you how to create a new Connected Air Conditioner device template for devices that send temperature telemetry to your application:
-
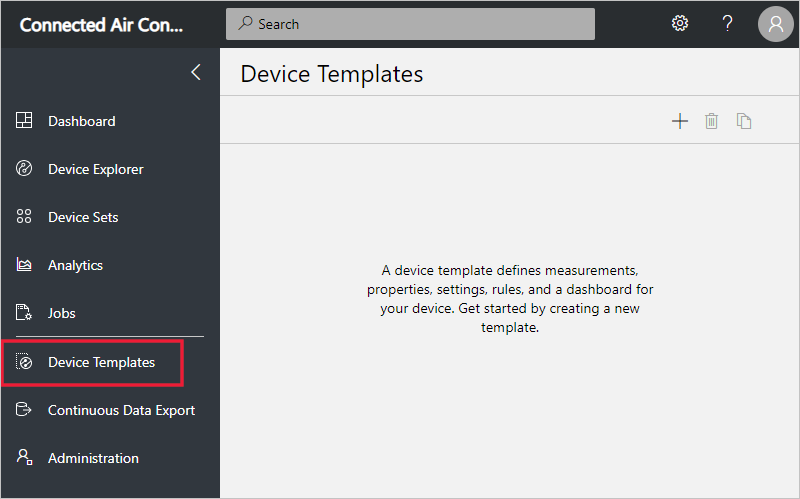
To add a new device template to your application, you need to go to the Device Templates page. To do so select the Device Templates on the left navigation menu.
-
On the Device Templates page, select + New or +:
-
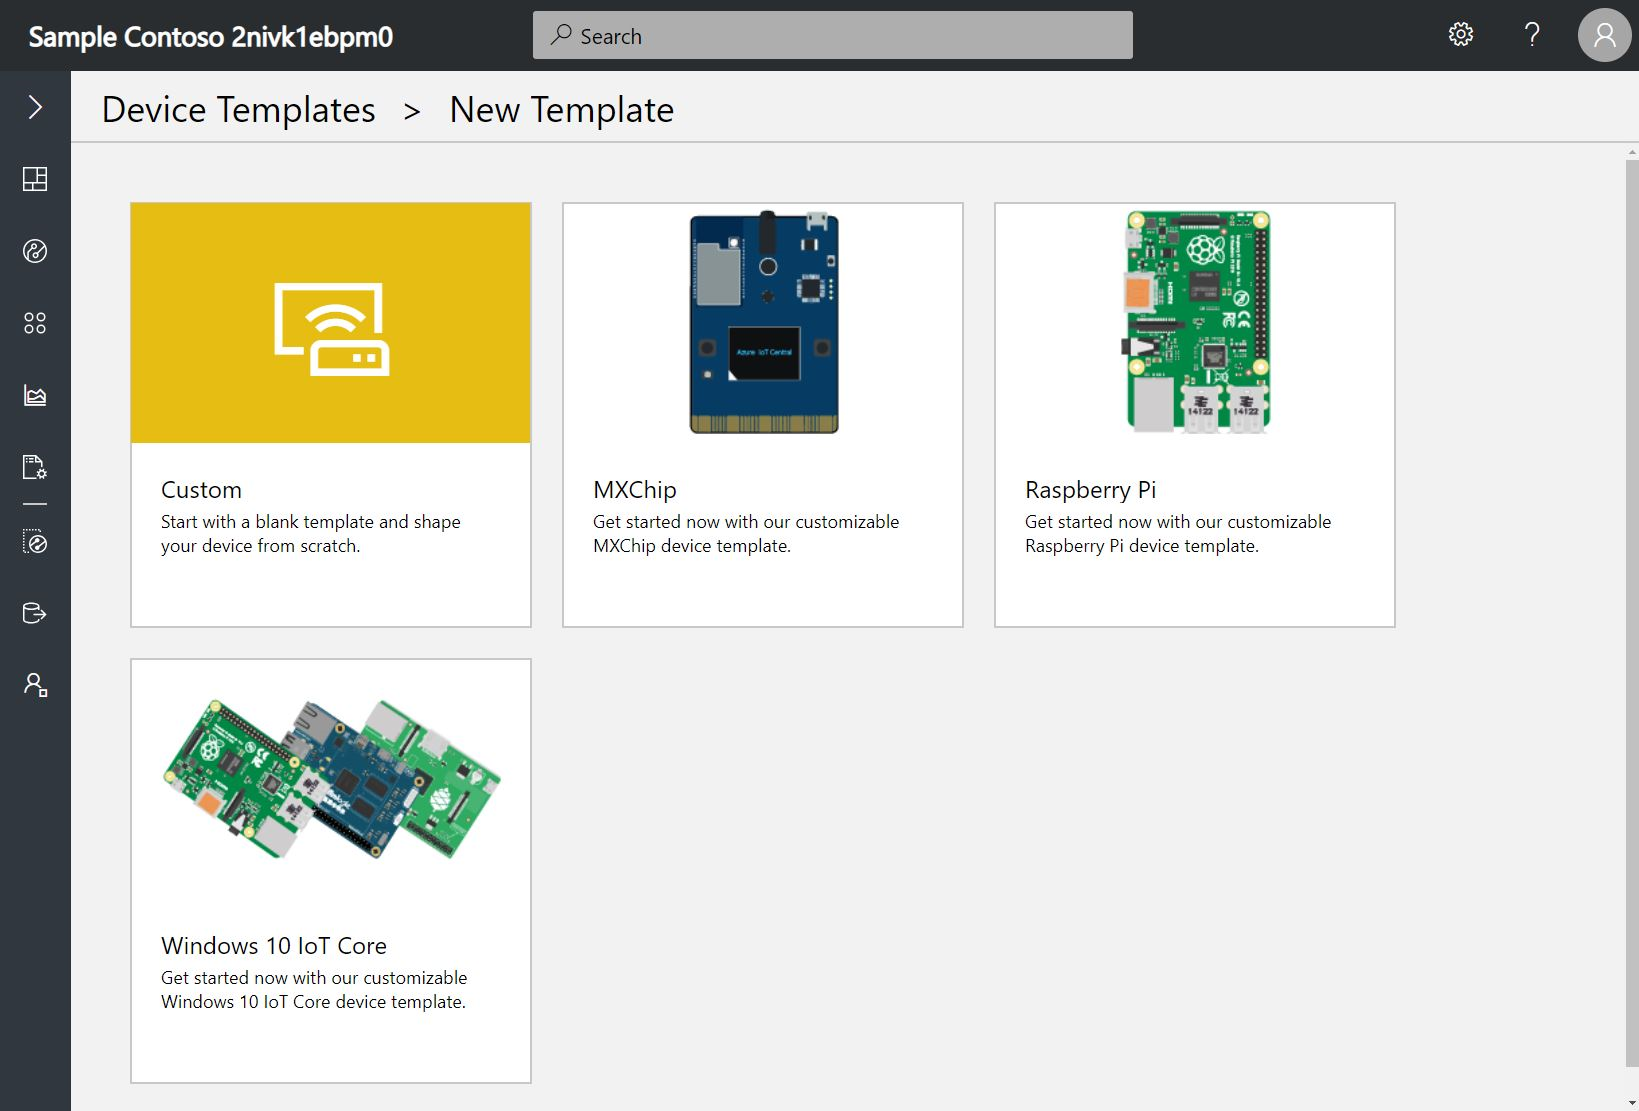
The page shows the templates you can choose from.
-
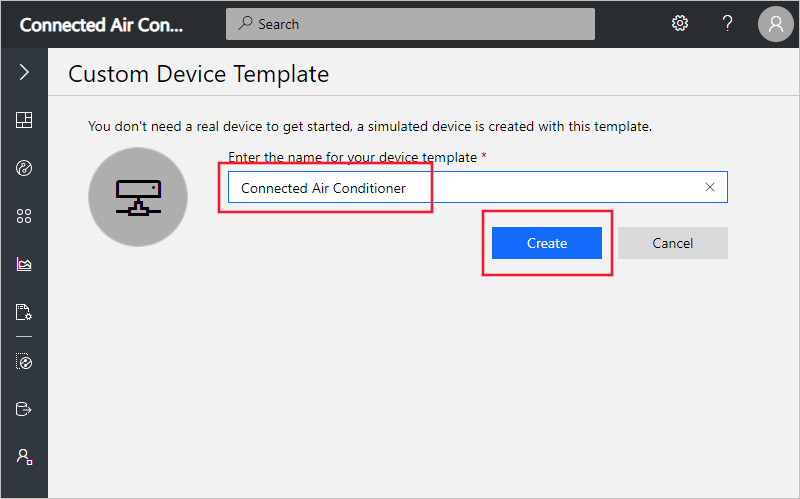
Select Custom, enter Connected Air Conditioner as the name of your device template, and then select Create. You can also upload an image of your device that’s visible to operators in the device explorer.
-
In the Connected Air Conditioner device template, make sure you’re on the Measurements tab where you define the telemetry.
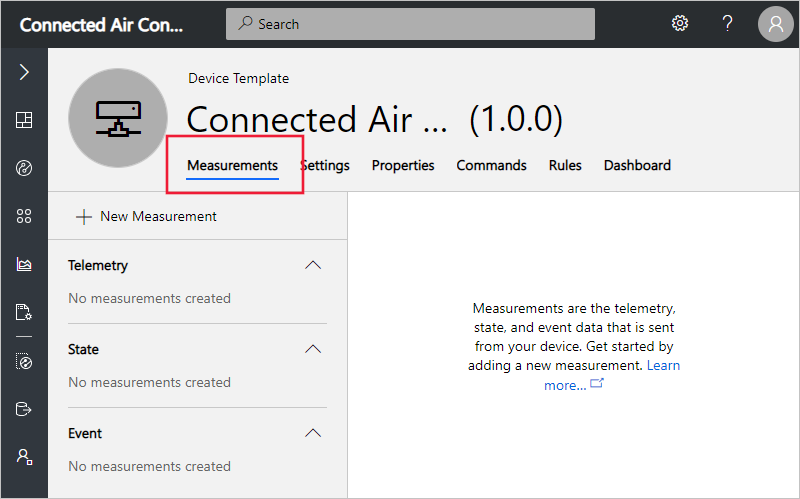
Note: To change the name of the device template, select the template name at the top of the page.
Add a telemetry measurement
-
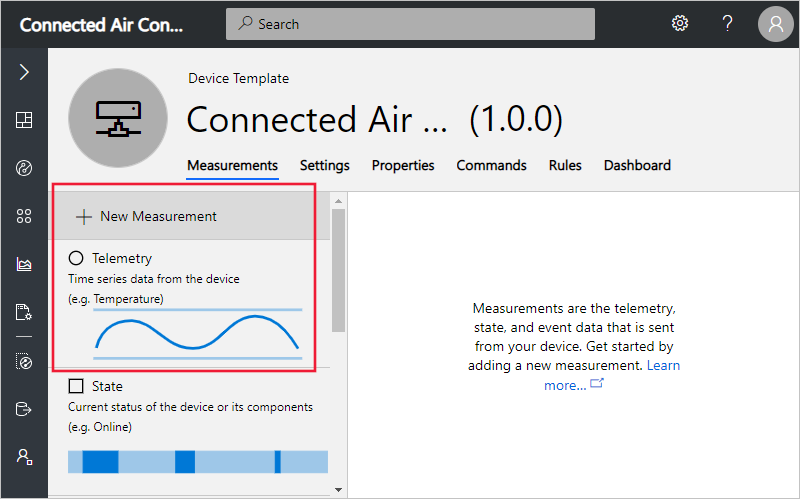
To add the temperature telemetry measurement, select + New Measurement. Then choose Telemetry as the measurement type.
-
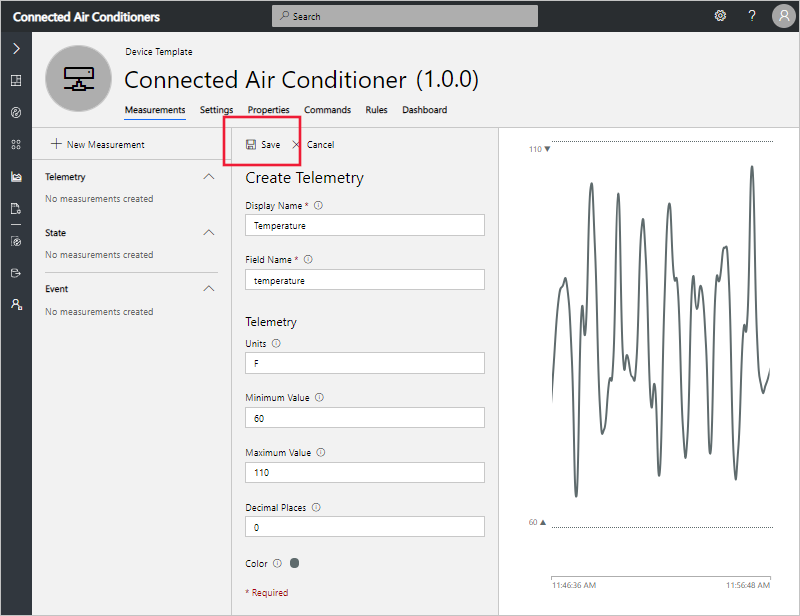
To create Temperature telemetry, use the information in the following table:
Setting Value Display Name Temperature Field Name temperature Units F Min 60 Max 110 Decimal places 0 You can also choose a color for the telemetry display. To save the telemetry definition, select Save:
-
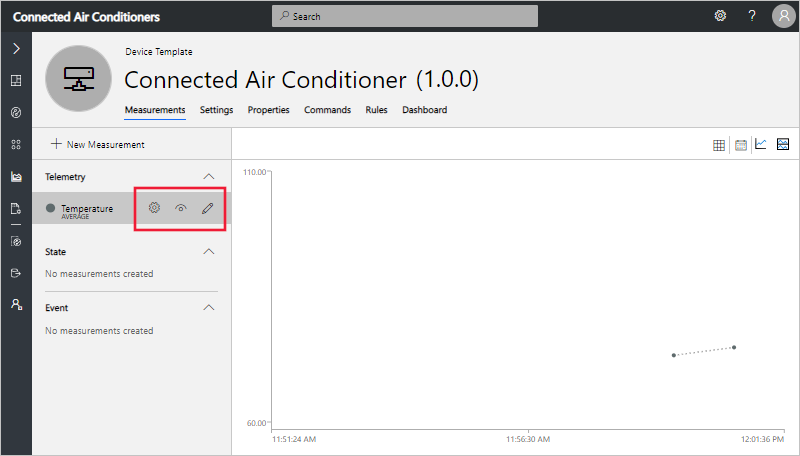
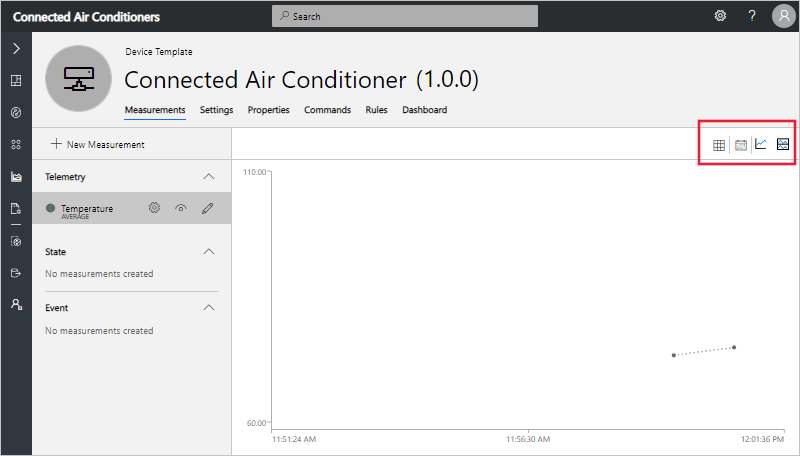
After a short while, the Measurements tab shows a chart of the temperature telemetry from your simulated connected air conditioner device. Use the controls to manage visibility, aggregation, or to edit the telemetry definition:
-
You can also customize the chart using the Line, Stacked, and Edit Time Range controls:
Add an event measurement
Use events to define point-in-time data that the device sends when there’s an event such as an error or a component failure. For this tutorial we will add Fan Motor Error as a new event measurement.
-
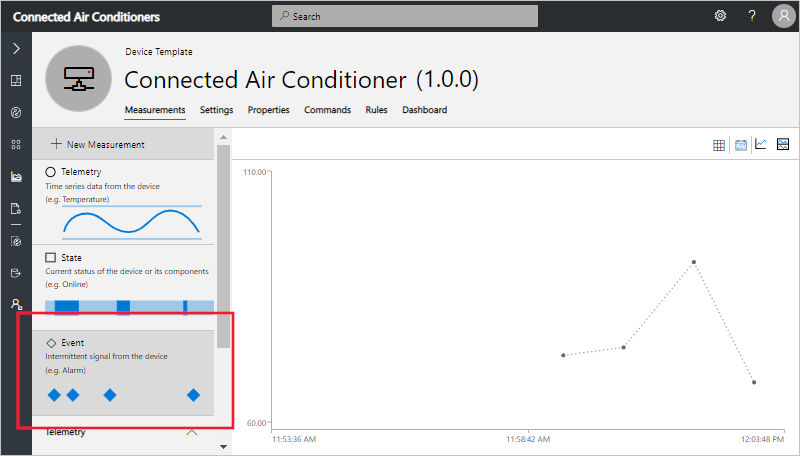
To add the Fan Motor Error event measurement, select + New Measurement. Then choose Event as the measurement type:
-
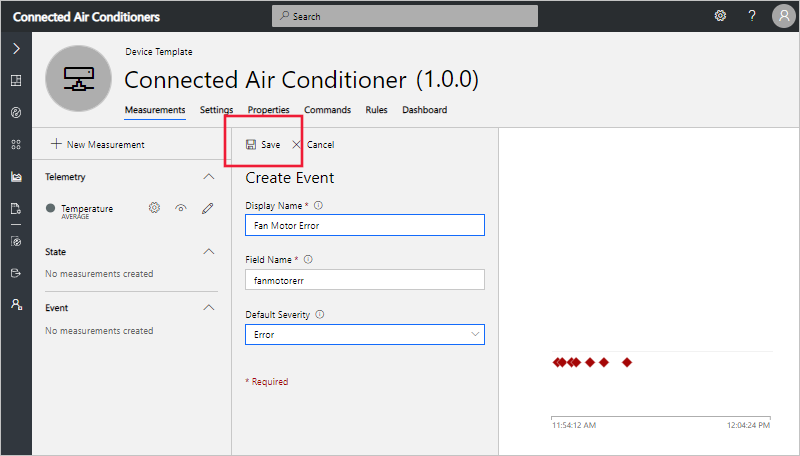
To create Fan Motor Error event, use the information in the following table:
Setting Value Display Name Fan Motor Error Field Name fanmotorerr Severity Error To save the event definition, select Save:
-
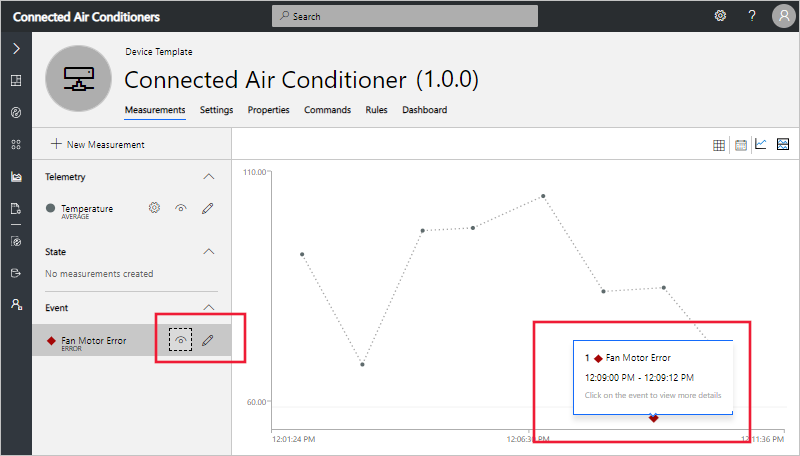
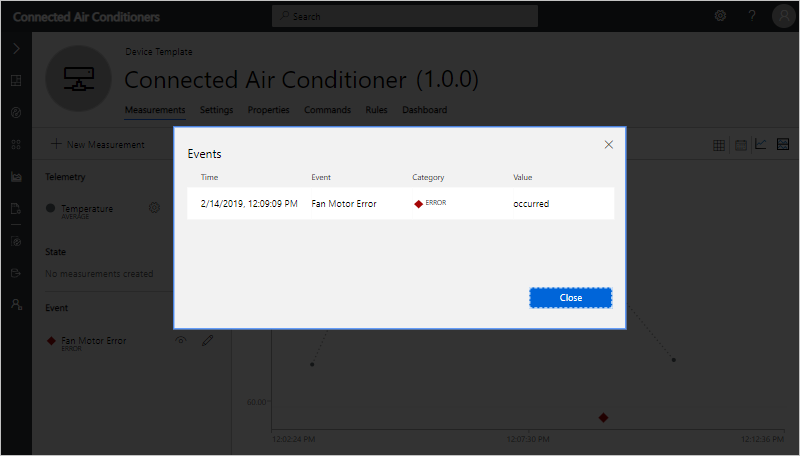
After a short while, the Measurements tab shows a chart of the events randomly generated from your simulated connected air conditioner device. Use the controls to manage visibility, or to edit the event definition:
-
To see additional details about the event, select the event on the chart:
Define a state measurement
You can use state to define and visualize the state of the device or its component over a period of time. For this tutorial we will add Fan Mode as a new state measurement.
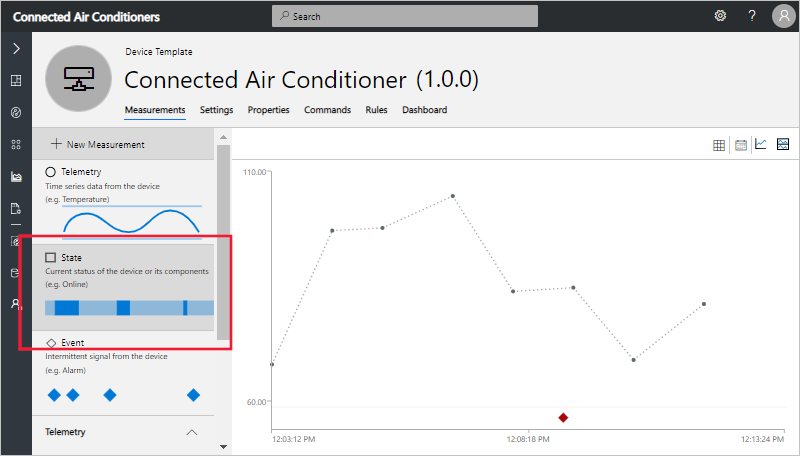
-
To add a Fan Mode state measurement, select + New Measurement. Then choose State as the measurement type:
-
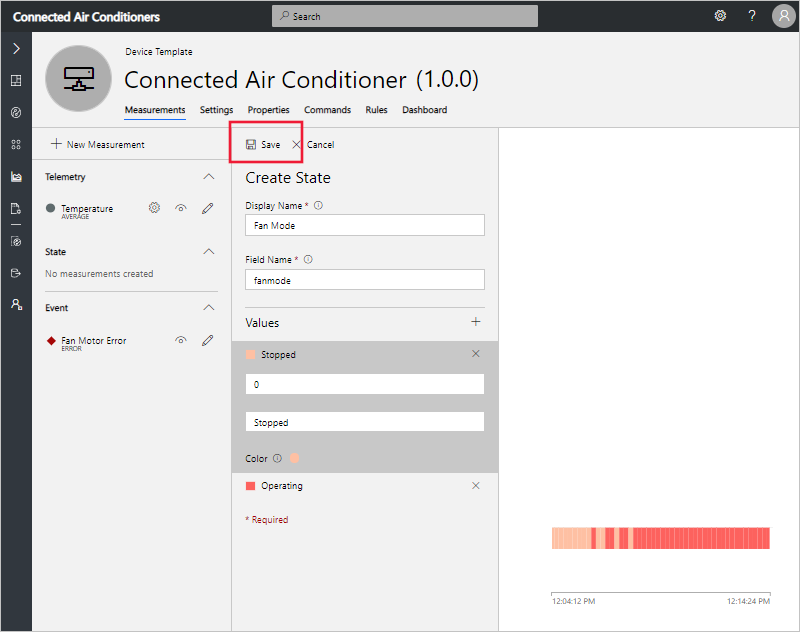
To configure Fan Mode state, use the information in the following table:
Setting Value Display Name Fan Mode Field Name fanmode Value 1 Display label Operating Value 0 Display label Stopped To save the state measurement definition, select Save:
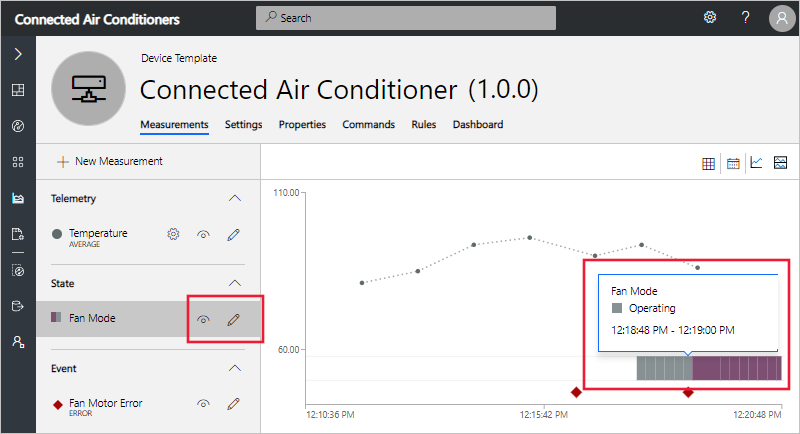
-
After a short while, the Measurements tab shows a chart of the states randomly generated from your simulated connected air conditioner device. Use the controls to manage visibility, or to edit the state definition:
Configure settings
You use settings to enable an operator to send configuration data to a device. For example, an operator could use a setting to change the device’s telemetry interval from two seconds to five seconds. In this section, you add a setting to your Connected Air Conditioner device template that enables an operator to set the target temperature of the connected air conditioner.
-
Navigate to the Settings tab for your Connected Air Conditioner device template.
-
You can create settings of different types such as numbers or text. Select Number to add a number setting to your device.
-
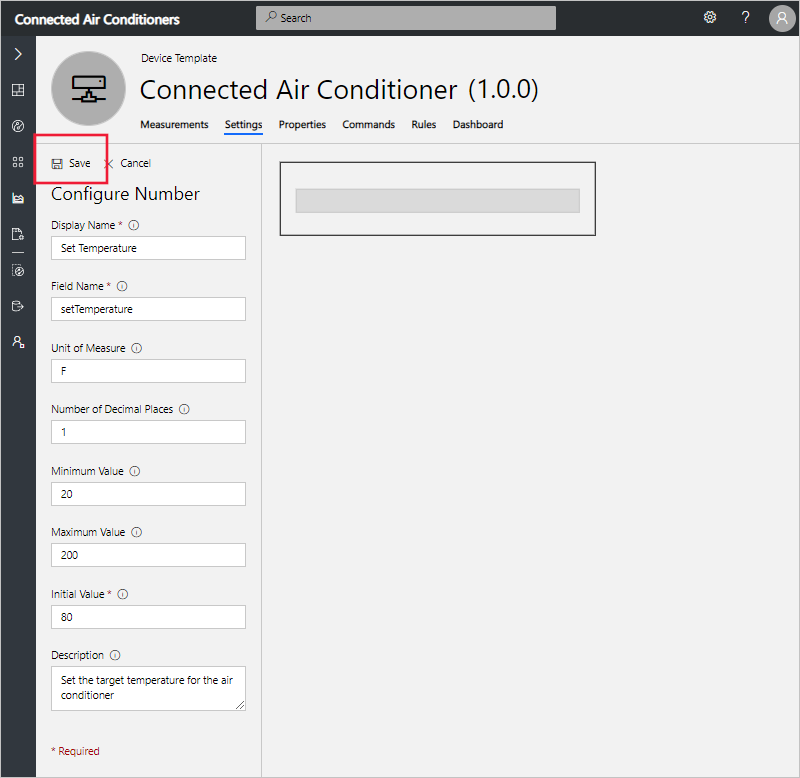
To configure your Set Temperature setting, use the information in the following table:
Field Value Display Name Set Temperature Field Name setTemperature Unit of Measure F Decimal Places 1 Minimum Value 20 Maximum Value 200 Initial Value 80 Description Set the target temperature for the air conditioner Then select Save:
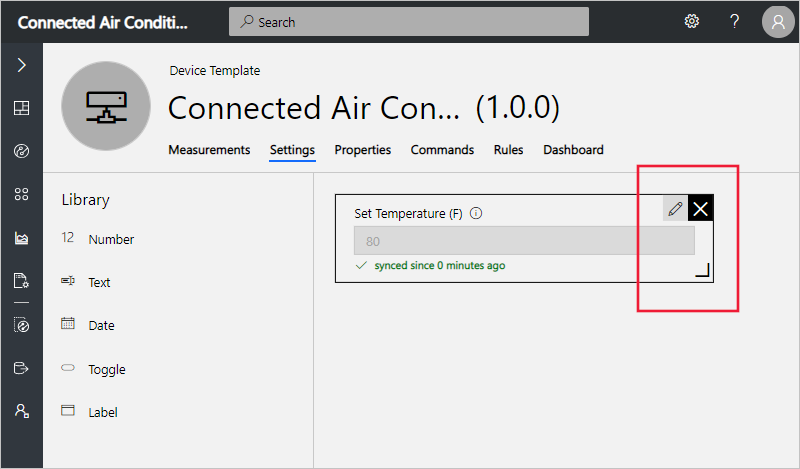
Note: When the device acknowledges a setting change, the status of the setting changes to synced.
-
You can customize the layout of the Settings tab by moving and resizing settings tiles:
Configure properties
Properties are used to define metadata that’s associated with your device. There are two categories of properties:
-
Application properties are used to record information about your device in your cloud solution. For example, you can use application properties to record a device’s last service date. These properties are stored in the application and don’t synchronize with the device.
-
Device properties are used to enable a device to send property values to your application. These properties can only be changed by the device. For an operator, device properties are read-only. In this scenario, the firmware version and device serial number are properties reported by the device.
-
Navigate to the Properties tab for your Connected Air Conditioner device template.
-
To add Last Service Date application property to your device template, choose Date and then enter the following information.
Field Value Display Name Last Service Date Field Name serviceDate Initial Value 1/1/2019 Description Last serviced 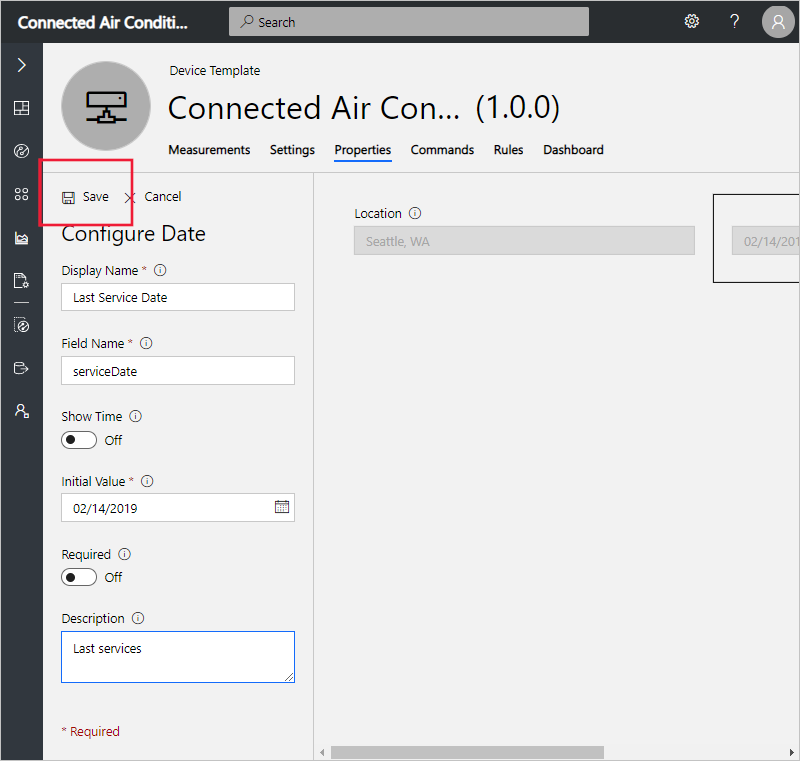
Select Save.
-
To add a Device property such as Firmware Version to your device template, choose Device Property and enter the following information:
Field Value Display Name Firmware version Field Name firmwareVersion Data Type text Description The firmware version of the air conditioner 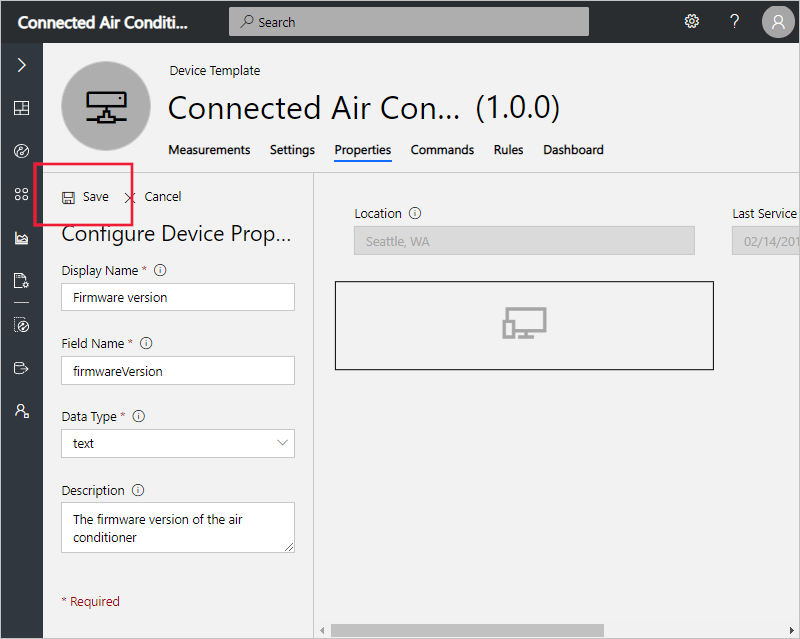
Select Save.
-
To add a location application property to your device template, choose Location. To configure your location property, use the information in the following table:
Field Value Display Name Installation Address Field Name location Initial Value Seattle, WA Description Installation Address Leave other fields with their default values.
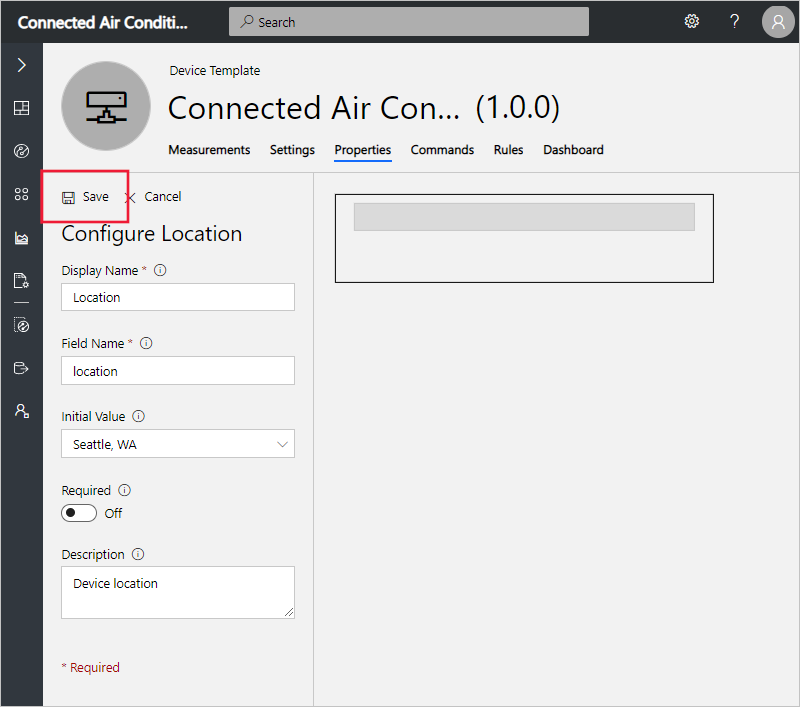
Select Save.
-
You can customize the layout of the Properties tab by moving and resizing property tiles.
Configure commands
You use commands to enable an operator to run commands directly on the device. In this section, you add a command to your Connected Air Conditioner device template that enables an operator to echo a certain message on the connected air conditioner.
-
Navigate to the Commands tab for your Connected Air Conditioner device template to edit the template.
-
Select + New Command to add a command to your device and begin configuring your new command.
-
To configure your new command, use the information in the following table:
Field Value Display Name Echo Command Field Name echo Default Timeout 30 Display Type text Description Device Command You can add additional inputs to the command by selecting + for Input Fields.
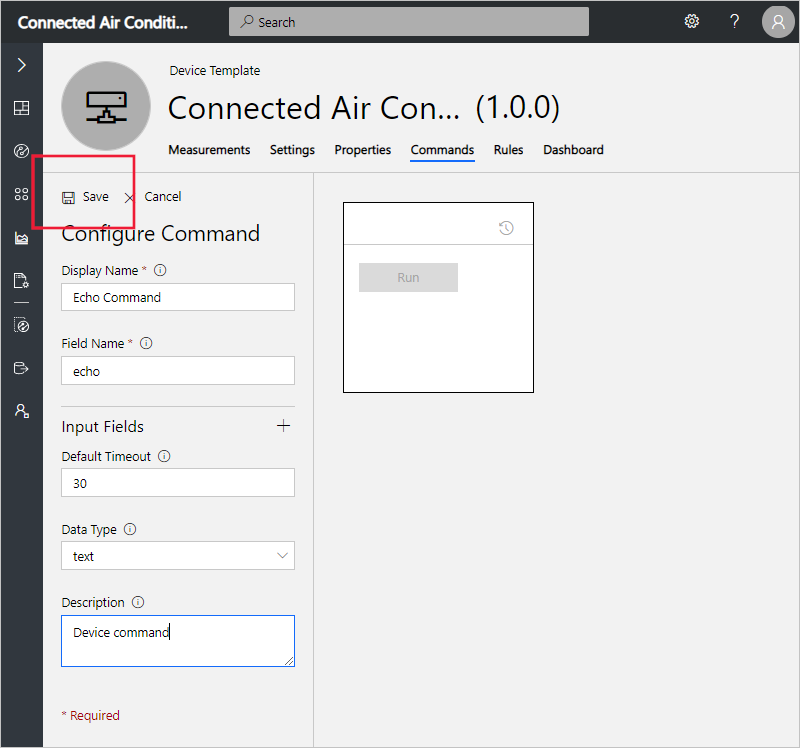
Select Save.
-
You can customize the layout of the Commands tab by moving and resizing the command tiles.
Configure Device Dashboard
Now you’ve defined your Connected Air Conditioner device template, you can customize its Dashboard to include the measurements, settings, and properties you defined. Then you can preview the dashboard as an operator:
-
Choose the Dashboard tab for your Connected Air Conditioner device template.
-
Select Line Chart to add the component onto the Dashboard.
-
Configure the Line Chart component using the information in the following table:
Setting Value Title Temperature Time Range Past 30 minutes Measures Temperature (select Visibility next to Temperature) 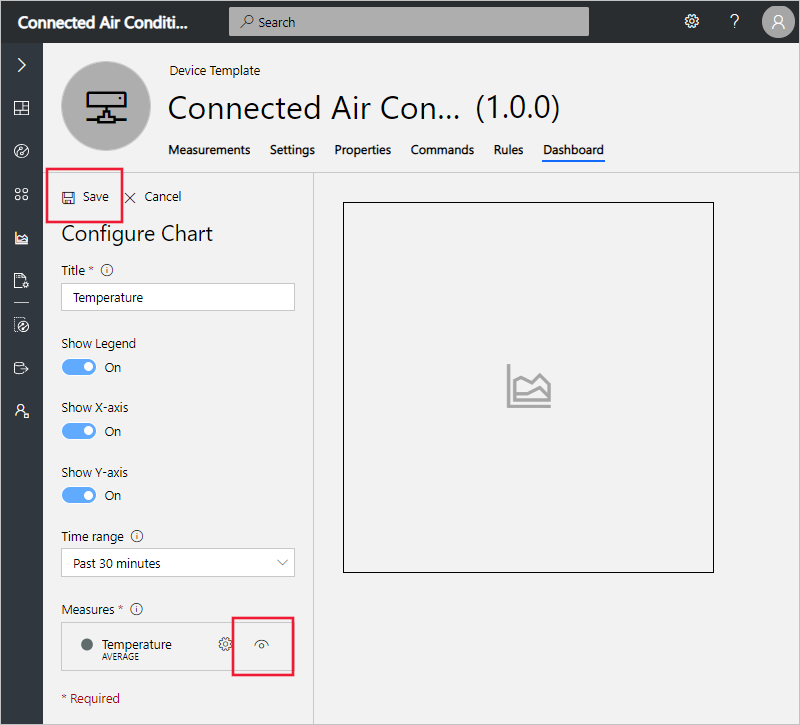
Then select Save.
-
Select the Event History component using the information in the following table:
Setting Value Title Fan Motor Events Time Range Past 30 minutes Measures Fan Motor Error (select Visibility next to Fan Motor Error) 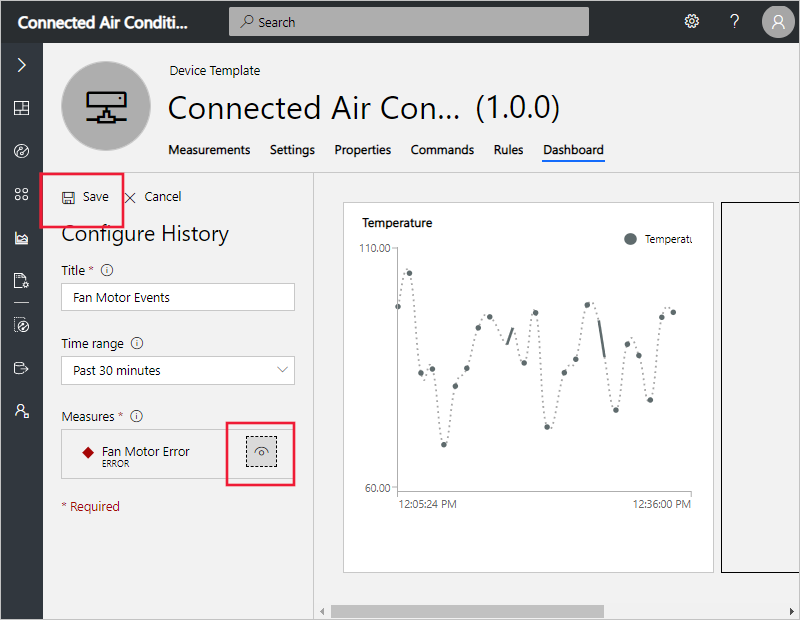
Then select Save.
-
Configure the State History component using the information in the following table:
Setting Value Title Fan Mode Time Range Past 30 minutes Measures Fan Mode (select Visibility next to Fan Mode) 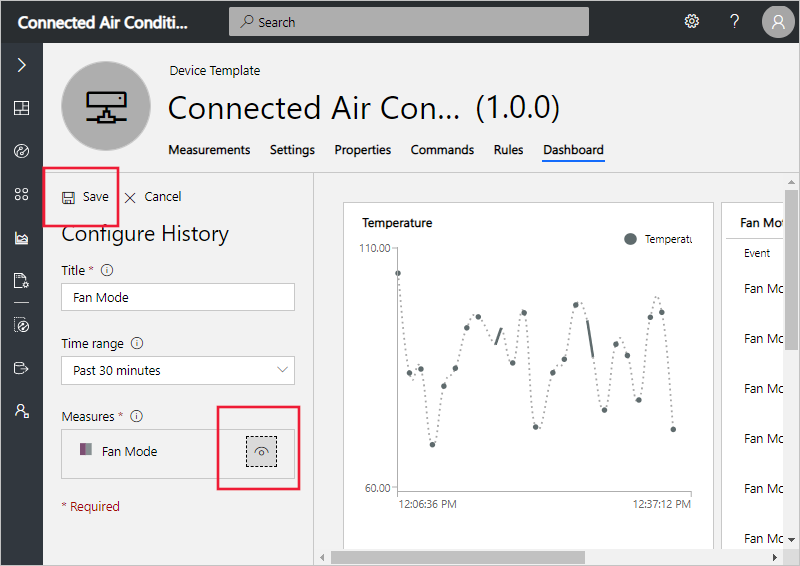
Then select Save.
-
To add the device settings and properties to the dashboard, choose Settings and Properties. Select Add/Remove to add the settings or properties that you’d like to see in the dashboard.
-
Configure the Settings and Properties component using the information in the following table:
Setting Value Title Device properties Settings and Properties Set Temperature
Firmware versionSettings and properties that you’ve previously defined on the Settings and Properties pages are shown in Available Columns.
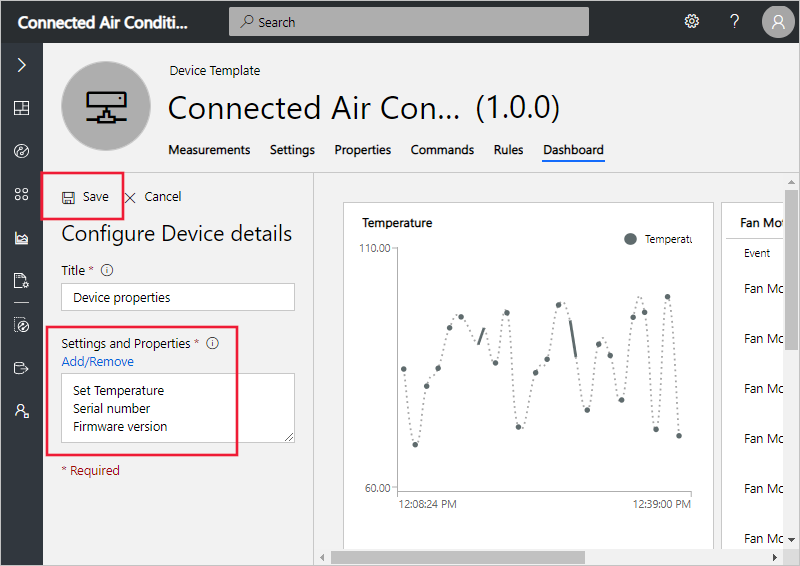
Then select Save.
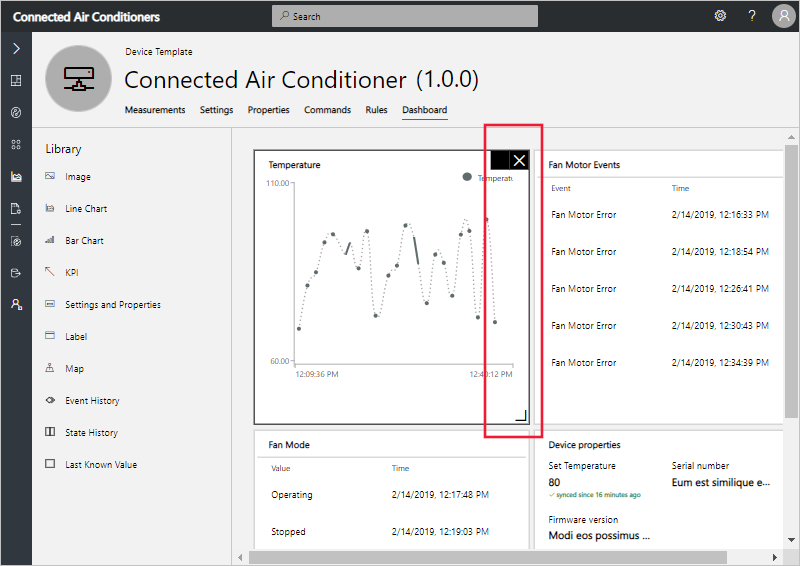
-
You can now see simulated data for your Connected Air Conditioner on the dashboard. You can edit the tiles and layout for the dashboard:
Tutorial: Connect MXChip Device to IoT Central
Now that you understand the basic concepts about a device template, we will import an existing template from the Device Template library and use it to connect a real MXChip device to Azure IoT Central.
Create MXChip device template
-
Navigate to the Device Templates page.
-
To create a template, start by selecting +New.
-
Choose MXChip from the pre-built templates, and click Create.
Note: When you create a device template, you will see the Device Details page for your new device template. IoT Central automatically creates a simulated device associated device template. A simulated device lets you test the behavior of your application before you connect a real device.
MXChip device template has the following characteristics:
- Telemetry which contains the measurements for the device Humidity, Temperature, Pressure, Magnetometer (measured along X, Y, Z axis), Accelerometer (measured along X, Y, Z axis) and Gyroscope (measured along X, Y, Z axis).
- State which contains an example measurement for Device State.
- Event measurement with a Button B Pressed event.
- Settings showing Voltage, Current, Fan Speed, and an IR toggle.
- Properties containing device property die number and Device Location which is a location property as well as in a Manufactured In cloud property.
-
To add a new device, choose Device Explorer in the left navigation menu. The Device Explorer shows the MXChip device template and the simulated device that was automatically created when you created the device template.
-
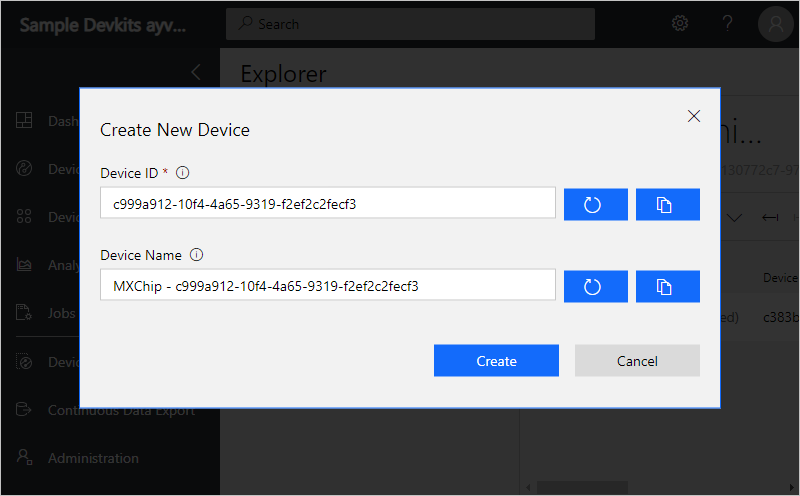
To start connecting a real MXChip, choose +New, then Real.
- Enter the Device Id (should be lower case) or use the suggested Device Id.
-
Enter the Device Name or use the suggested name.
-
Get connection details such as Scope ID, Device ID, and Primary SAS key for the added device by selecting Connect on the device page.
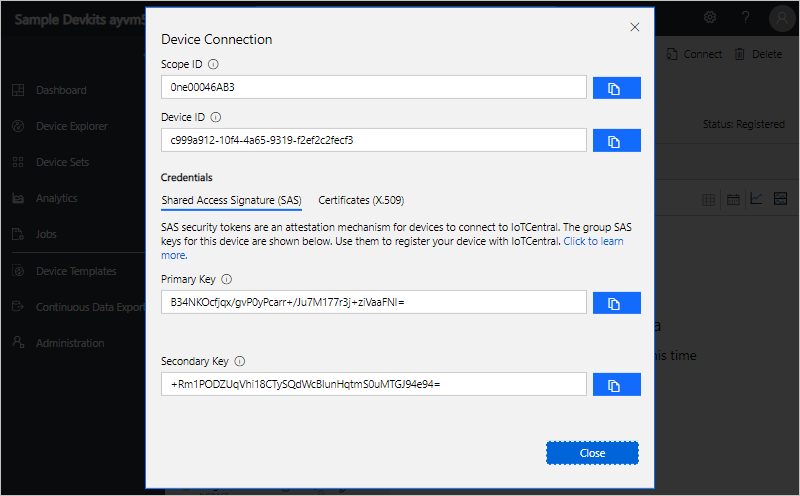
-
Make sure to save these details, as you will temporarily get disconnected from the internet as you prepare the DevKit device.
Prepare the DevKit device
Note: If you have previously used the device and have wifi credentials stored and would like to reconfigure the device to use a different WiFi network, connection string, or telemetry measurement, press both the A and B buttons on the board simultaneously. If it doesn’t work, press reset button and try again.
To prepare the DevKit device
- Download the latest pre-built Azure IoT Central firmware for the MXChip from the releases (https://aka.ms/iotcentral-docs-MXChip-releases) page on GitHub.
- Connect the DevKit device to your development machine using a USB cable. In Windows, a file explorer window opens on a drive mapped to the storage on the DevKit device. For example, the drive might be called AZ3166 (D:).
-
Drag the iotCentral.bin file onto the drive window. When the copying is complete, the device reboots with the new firmware.
-
When the DevKit device restarts, the following screen displays:
 Connect HotSpot:
 AZ3166_??????
 go-> 192.168.0.1
 PIN CODE xxxxx
[!NOTE] If the screen displays anything else, reset the device and press the A and B buttons on the device at the same time to reboot the device.
-
The device is now in access point (AP) mode. You can connect to this WiFi access point from your computer or mobile device.
-
On your computer, phone, or tablet connect to the WiFi network name shown on the screen of the device. When you connect to this network, you do not have internet access. This state is expected, and you are only connected to this network for a short time while you configure the device.
-
Open your web browser and navigate to http://192.168.0.1/start. The following web page displays:
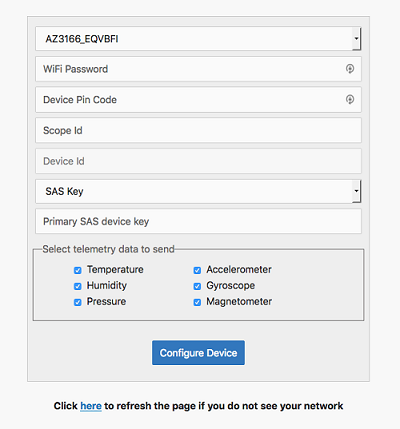
In the web page:
- add the name of your WiFi network
- your WiFi network password
- PIN CODE shown on the device LCD
- the connection details Scope Id, Device Id, and Primary key of your device (you should have already saved this following the steps)
- Select all the available telemetry measurements!
Note: You can connect to MSFTGuest or your phone’s Hotspot
-
After you choose Configure Device, you see this page:
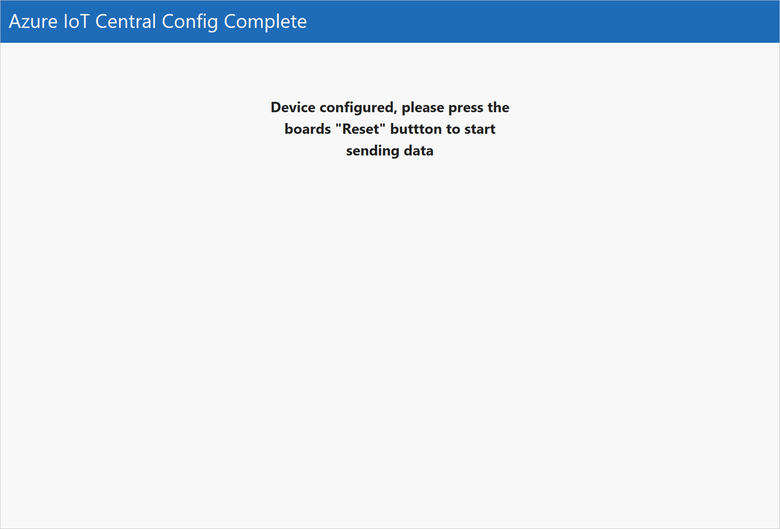
-
Press the Reset button on your device.
View the telemetry
When the DevKit device restarts, the screen on the device shows:
- The number of telemetry messages sent.
- The number of failures.
- The number of desired properties received and the number of reported properties sent.
Note: If the device appears to be looping during connect check if the device is Blocked in IoT Central, and Unblock the device so it can connect to the app.
Shake the device increment the number of reported properties sent. The device sends a random number as the Die number device property.
You can view the telemetry measurements and reported property values, and configure settings in Azure IoT Central:
-
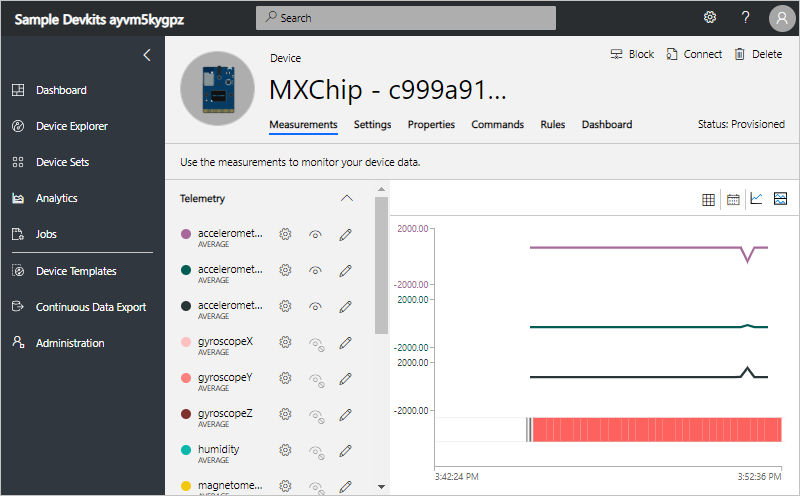
Use Device Explorer to navigate to the Measurements page for the real MXChip device you added:
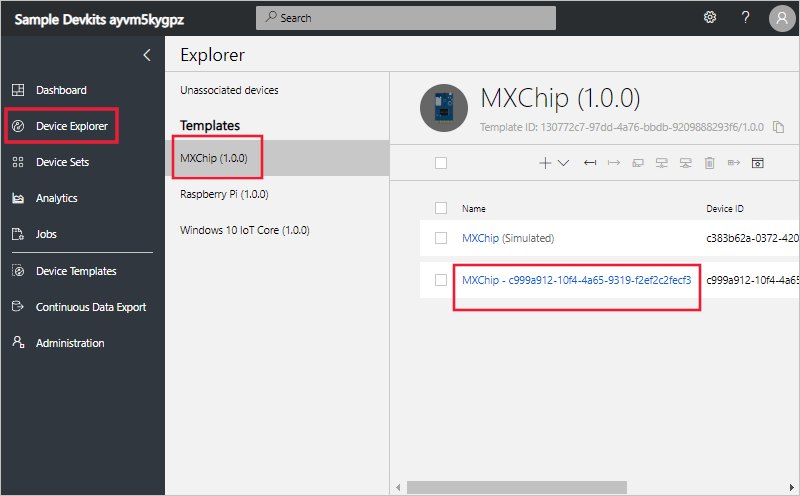
-
On the Measurements page, you can see the telemetry coming from the MXChip device:
-
On the Properties page, you can view the last die number and the device location reported by the device:
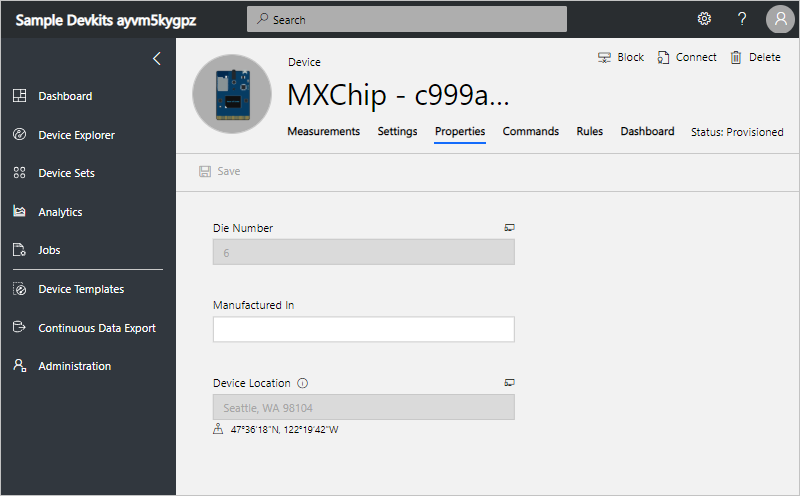
-
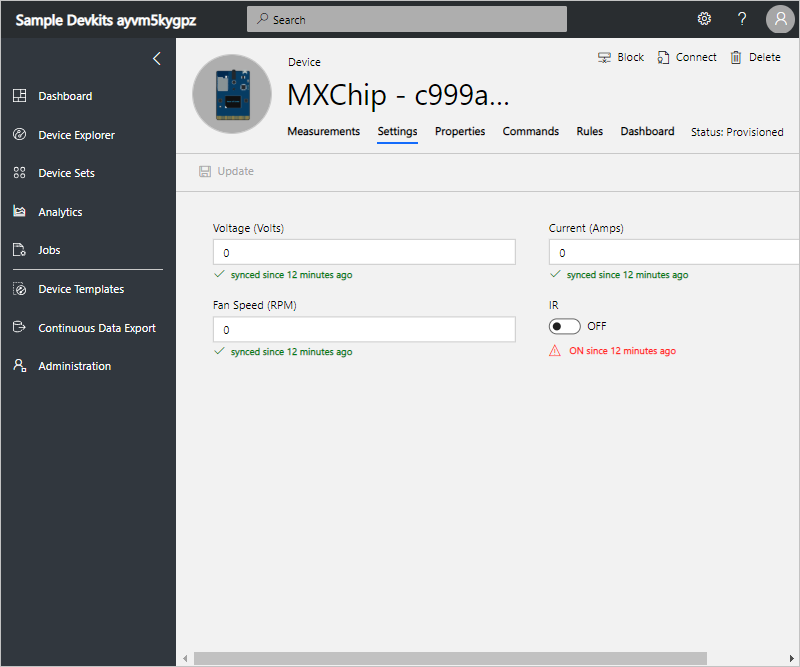
On the Settings page, you can update the settings on the MXChip device:
Tutorial: Configure rules and actions for your device
This article applies to operators, builders, and administrators.
In this tutorial, you create a rule that sends an email when the temperature reported by MXChip device exceeds 90° F.
Create a rule to monitor device telemetry
-
To add a new telemetry-based rule to your application, in the left navigation menu, select Device Templates:
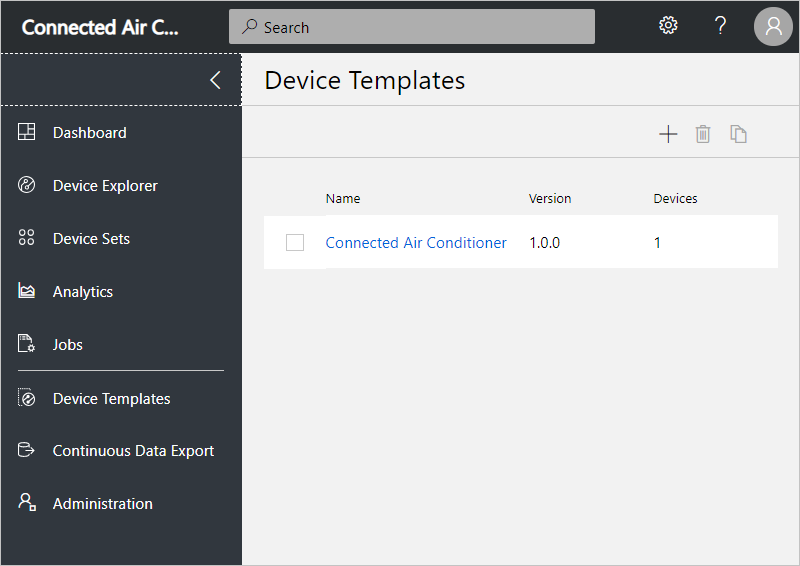
You see the MXChip device template you created in the previous tutorial.
-
To customize your device template, select the MXChip template you created in the previous tutorial.
-
To add a telemetry-based rule in the Rules view, select Rules, select + New Rule, and then select Telemetry:
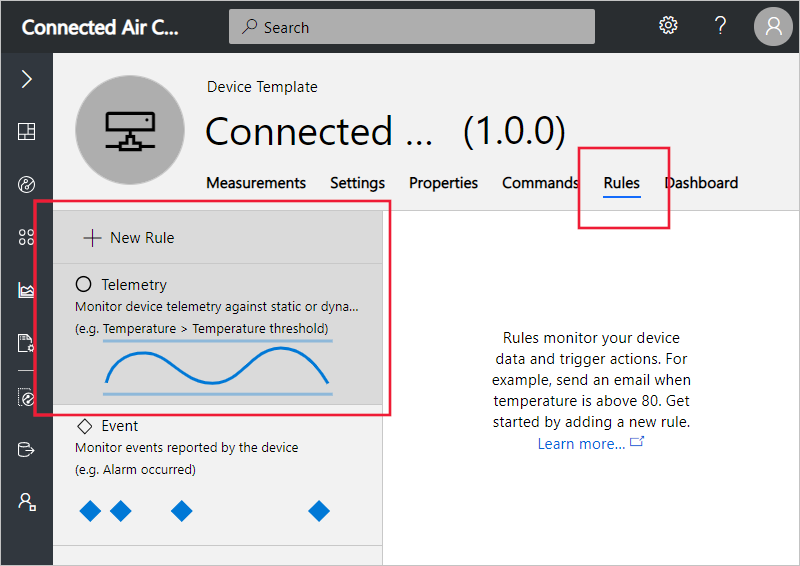
-
To define your rule, use the information in the following table:
Setting Value Name MChip temperature alert Enable rule for all devices of this template On Condition Temperature is greater than 90 Aggregation None 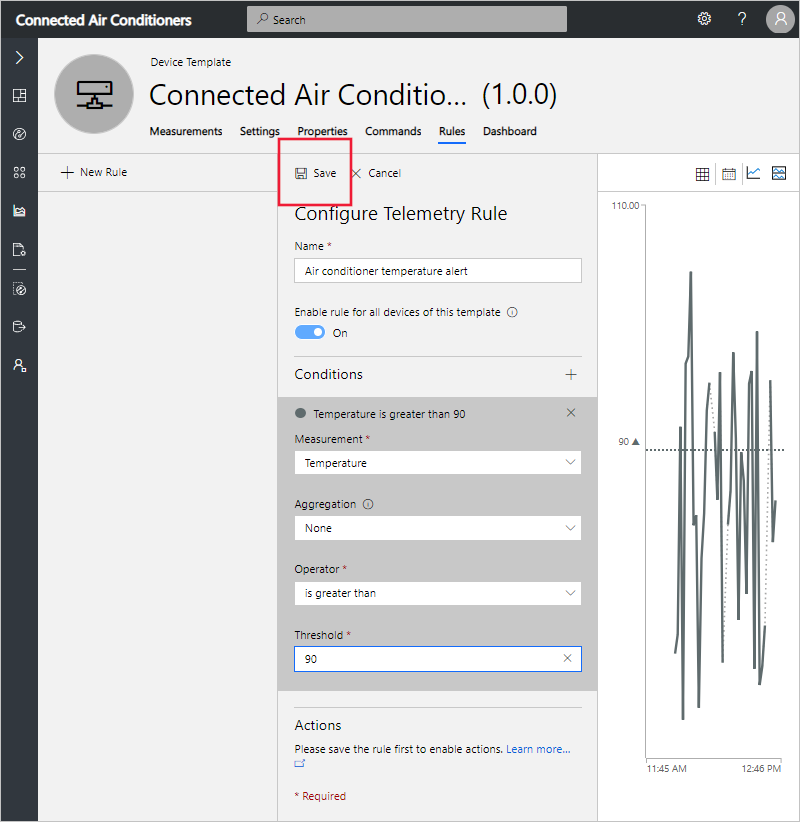
Then select Save.
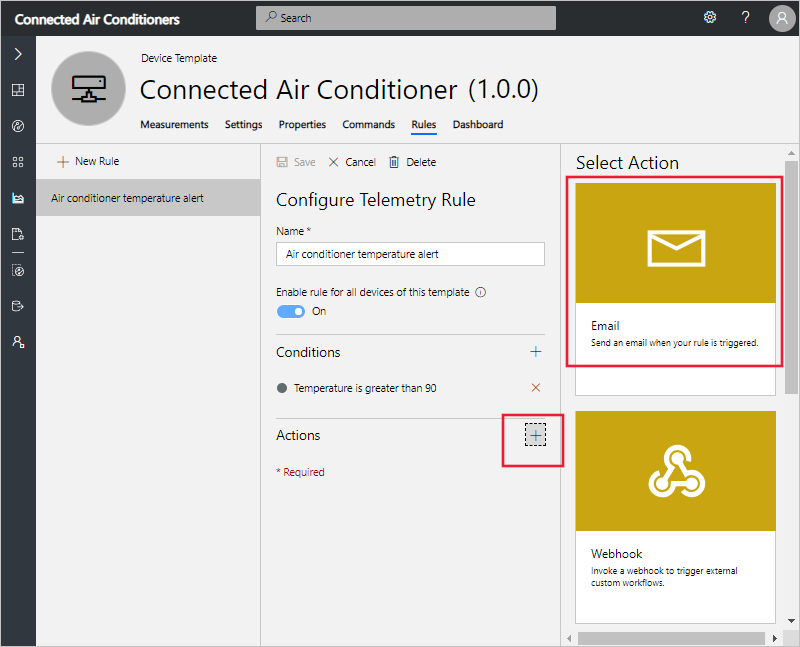
Add an action
When you define a rule, you also define an action to run when the rule conditions are met. In this tutorial, you create a rule with an action that sends an email notification.
-
To add an Action, first Save the rule and then scroll down on the Configure Telemetry Rule panel. Choose the + next to Actions, and then choose Email:
-
To define your action, use the information in the following table:
Setting Value To Your email address Notes MXChip temperature exceeded the threshold. Note: To receive an email notification, the email address must be a user ID in the application, and that user must have signed in to the application at least once.
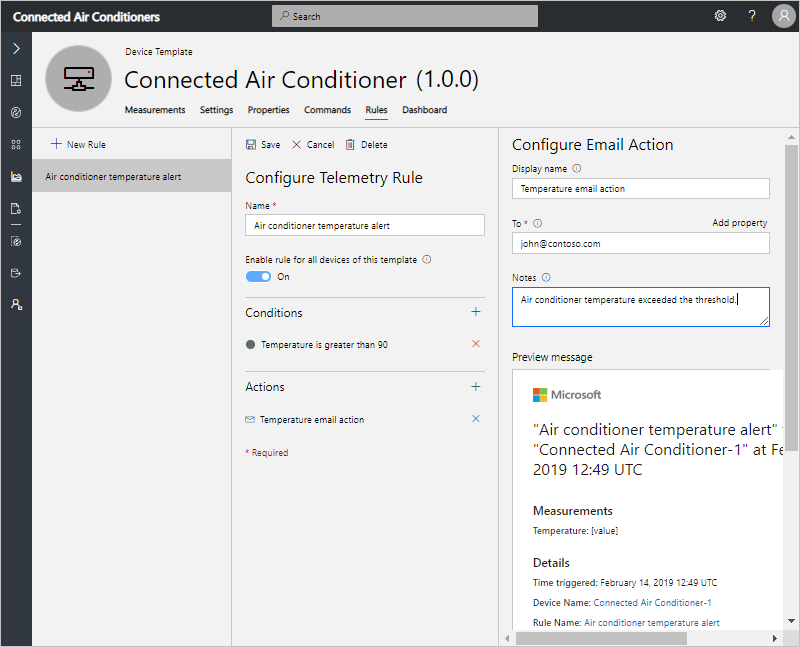
-
Select Save. Your rule is listed on the Rules page.
Test the rule
Shortly after you save the rule, it becomes live. When the conditions defined in the rule are met, your application sends a message to the email address you specified in the action.
Note: After your testing is complete, turn off the rule to stop receiving alerts in your inbox.
Tutorial: Administer Your Application
Navigate to the Administration section by choosing Administration on the left navigation menu.
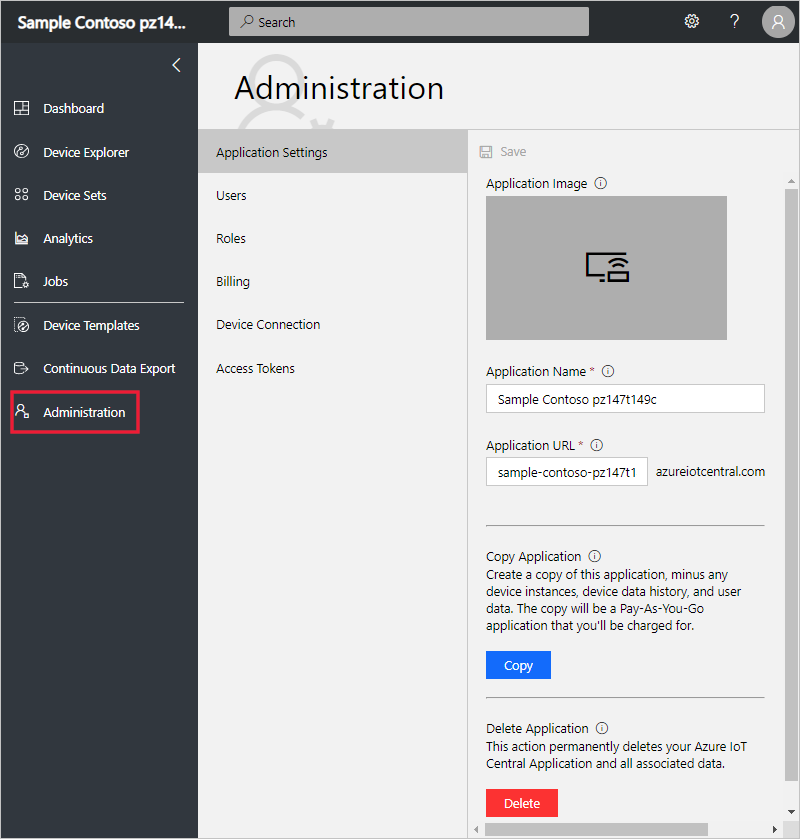
The Administration section enables you to:
- Manage users
- Assign roles
Now we are going to add users as Operators and Builders
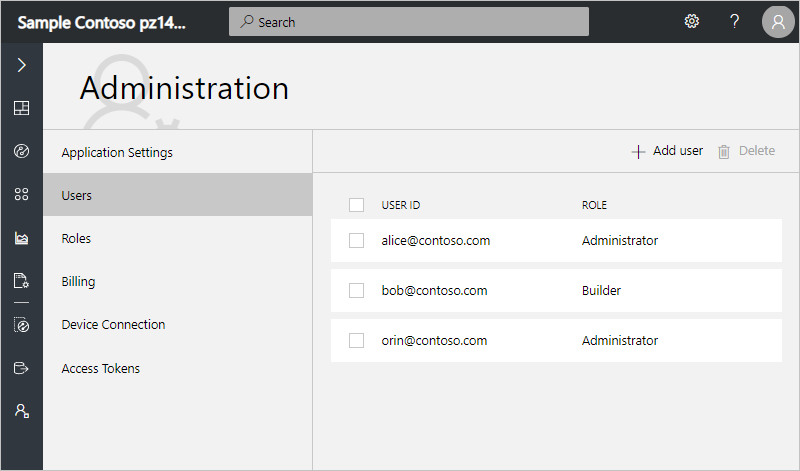
- To add a user account to an Azure IoT Central application, use the secondary navigation menu to navigate to the Users page in the Administration section
-
On the Users page, choose “Add User” to add a user.
-
When you add a user to your Azure IoT Central application, choose a role for the user from the Role drop-down.
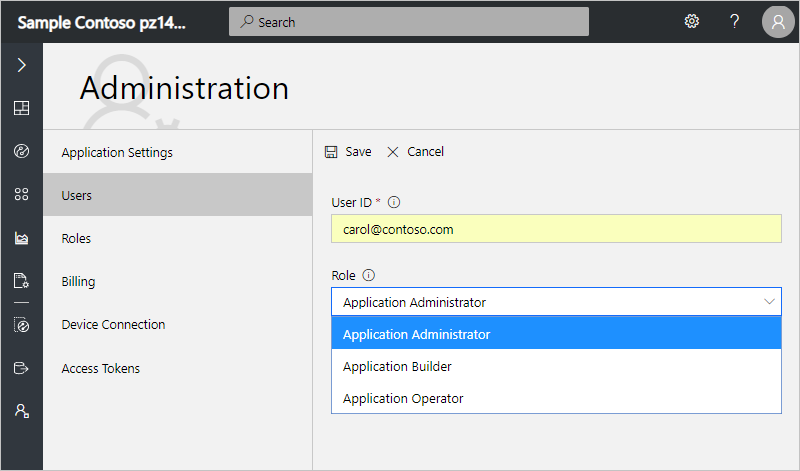
Note: To add users in bulk, enter the User IDs of all the users you’d like to add separated by semi-colons. Choose a role from the Role drop-down and choose Save.
- After you add a user, an entry appears for that user on the Users page
Note: Edit the roles assigned to users. Roles cannot be changed once assigned. To change the role assigned to a user, delete the user and add the user again with a different role.
Next Steps
To continue to learn about Azure IoT Central, try out the following features: