Deploy Azure Stream Analytics as an IoT Edge module
Overview
Azure IoT Edge and Azure Stream Analytics are integrated so that you can create an Azure Stream Analytics job in the Azure portal and then deploy it as an IoT Edge module with no additional code.
The Stream Analytics module in this task calculates the average temperature over a rolling 30-second window. When that average reaches 70, the module sends an alert for the device to take action. In this case, that action is to reset the simulated temperature sensor.
Create an Azure Stream Analytics job
Create an Azure Stream Analytics job to take data from your IoT hub, query the sent telemetry data from your device, and then forward the results to an Azure Blob storage container.
Create a storage account
When you create an Azure Stream Analytics job to run on an IoT Edge device, it needs to be stored in a way that can be called from the device. You can use an existing Azure storage account, or create a new one now.
Create Azure Blob Storage
-
In your Web browser, to open your Azure portal, navigate to the portal.azure.com.
When you log into Azure you will arrive at the Azure portal home page for your Azure account.
-
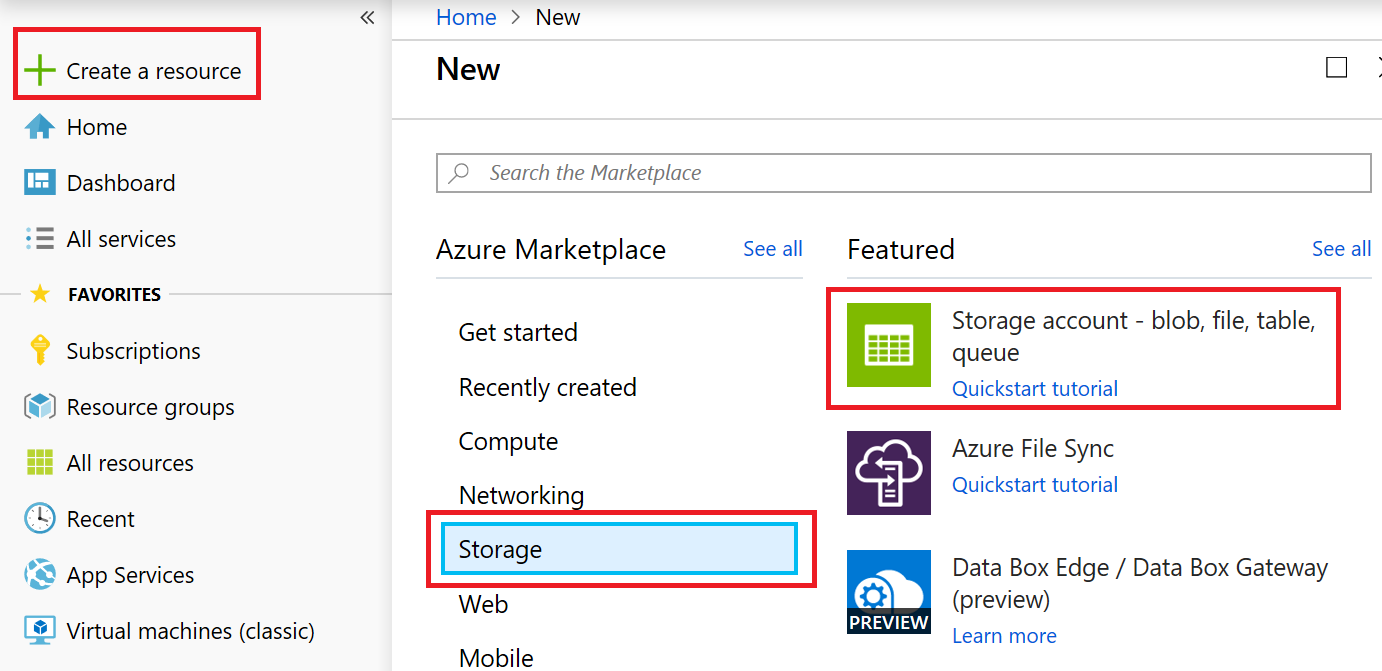
Click + Create a resource and click on Storage and click Storage account - blob, file, table, queue.
-
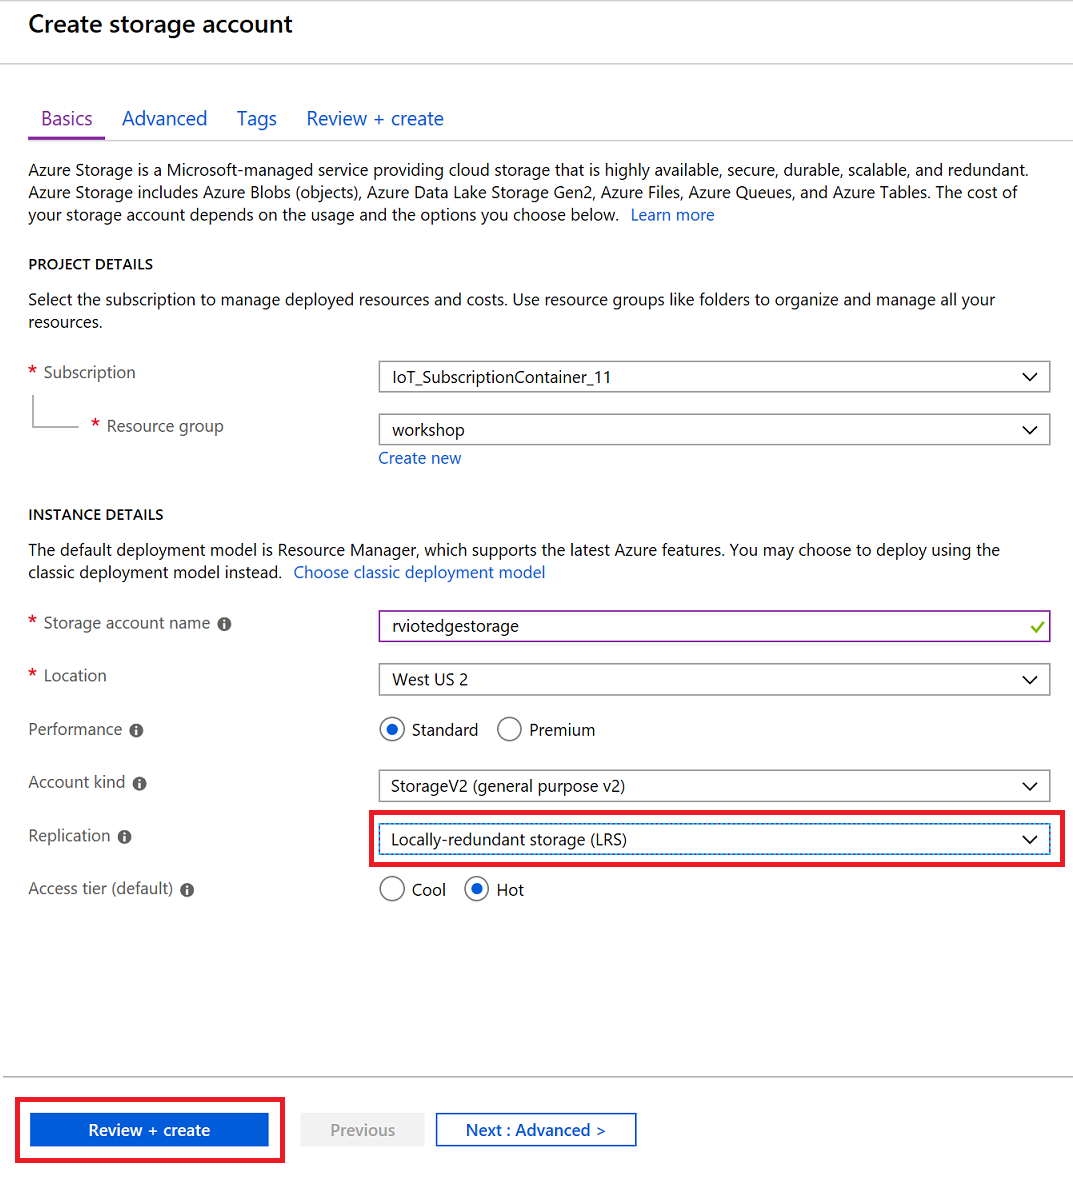
Provide details and make sure to select Locally Redundant Storage (LRS), cheapest option. Click on Create and Review button. Click on **Create button.
Set up Azure Stream Analytics
-
Open a browser and navigate to the Azure Portal https://portal.azure.com
-
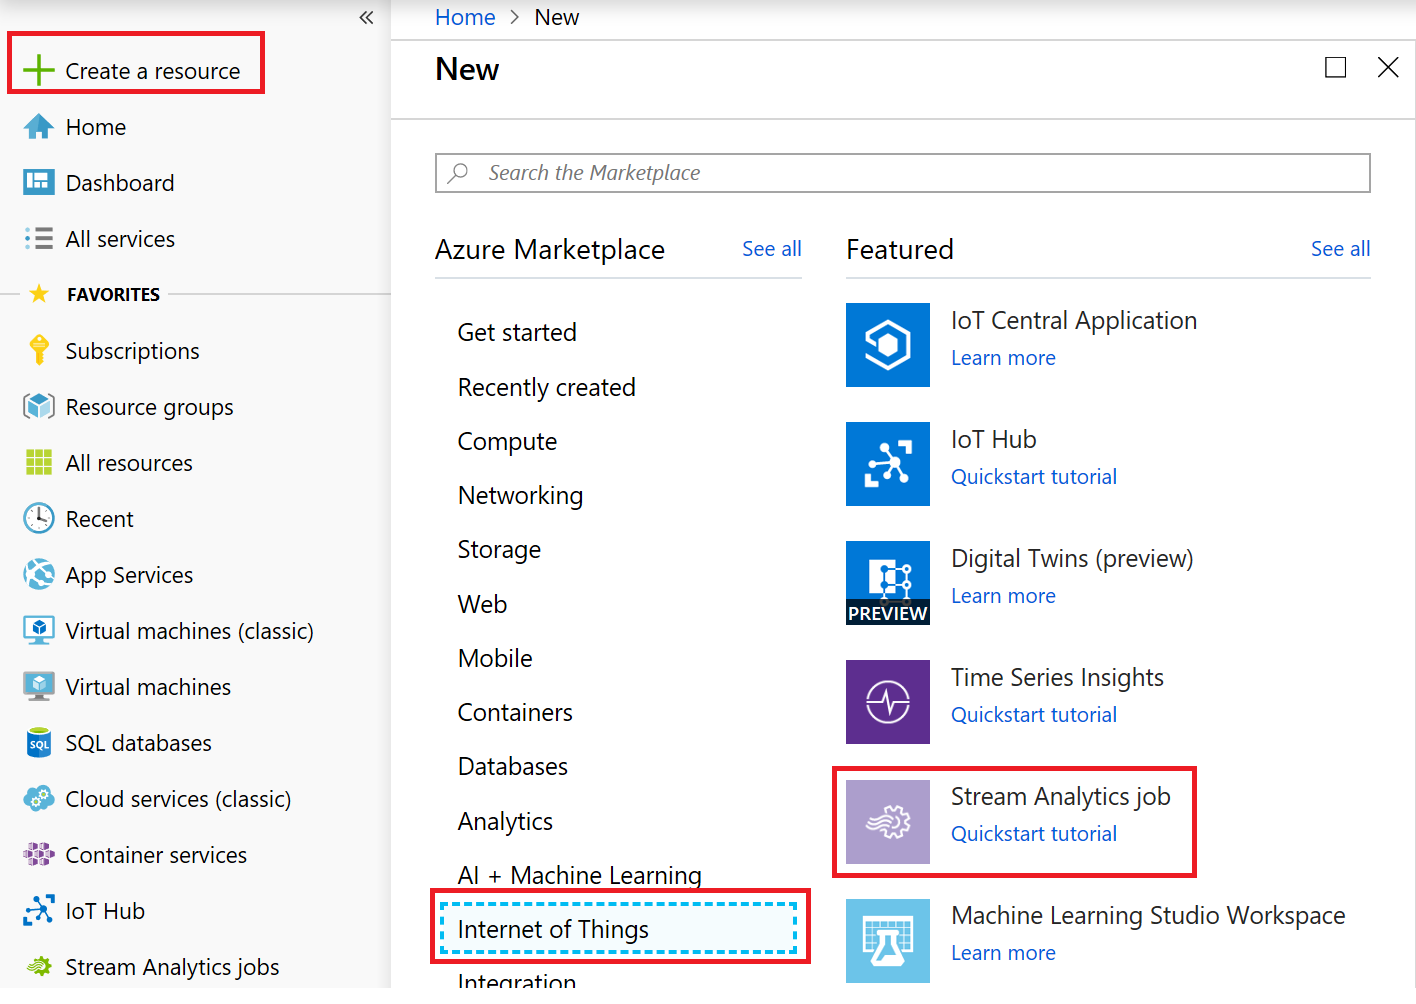
In the Azure portal, in the left-hand navigation area, click Create a resource -> Internet of Things -> Stream Analytics Job.
-
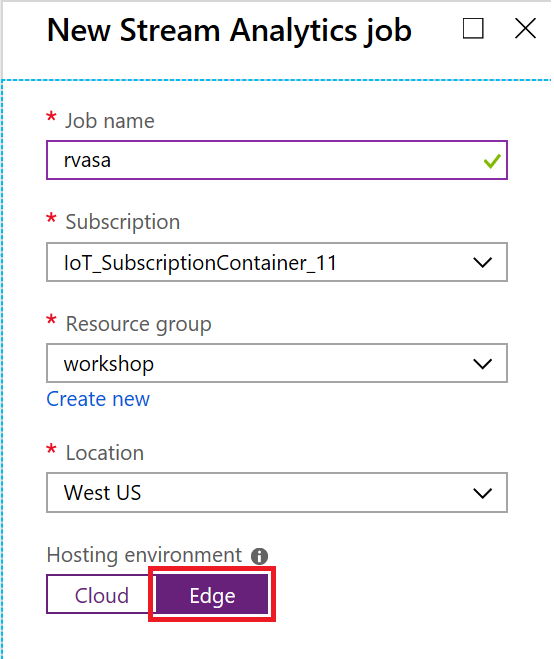
In the New Stream Analytics job blade, enter a globally unique name.
-
Under Hosting environment, select Edge.
You can see the option here for creating an analytics job that would run under the cloud or IoT Edge.
-
At the bottom of the New Stream Analytics job blade, click Create.
-
Once the deployment has succeeded, click Go to resource.
The Stream Analytics job blade will open, displaying the Overview pane.
-
On the Stream Analytics job blade in the left hand nav area, under Job topology, click Inputs.
-
In the Inputs pane, click Add stream input and then select Edge Hub.
The New input popup will then be displayed.
-
Under Input alias, enter temperature.
-
Under Event serialization format, select JSON.
In order to query the message data, the Analytics job must understand the message format. JSON is the standard, but AVRO and CSV are also supported.
-
Under Encoding, select UTF-8.
UTF-8 is the only JSON encoding supported at the time of writing.
-
Under Event compression type, select None.
GZIP and Default formats are supported.
-
At the bottom of the New input popup, click Save.
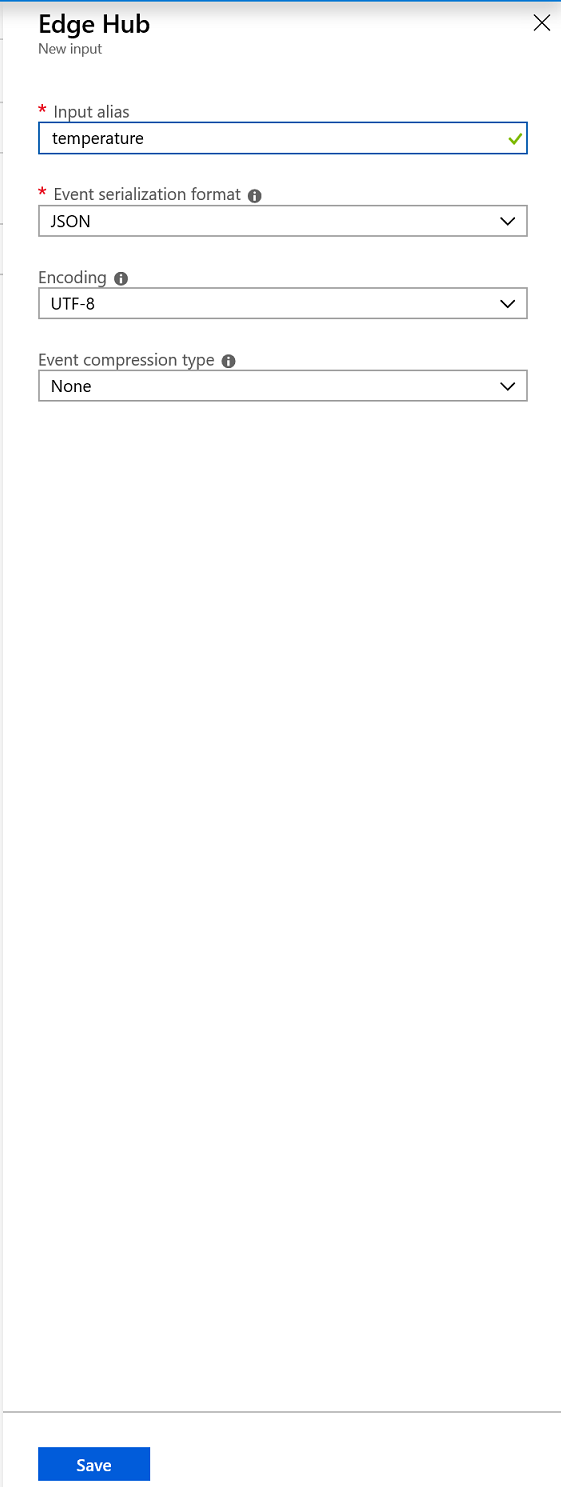
The New input popup closes and the Inputs pane is displayed. The new stream input should be listed.
-
In the Stream Analytics Job blade left hand nav area, under Job topology, click Outputs.
This will display the Outputs pane. You should see an empty list.
-
At the top of the Outputs pane, click Add and select Edge Hub.
A New output popup will open that you can use to select the Azure Function details.
-
Under Output alias, enter alert.
-
Under Event serialization format, select JSON.
In order to query the message data, the Analytics job must understand the message format. JSON is the standard, but AVRO and CSV are also supported.
-
Under Encoding, select UTF-8.
-
At the bottom of the New output popup, click Save.
After a brief pause, the New output popup closes and the Outputs list updates to include the output we just created.

-
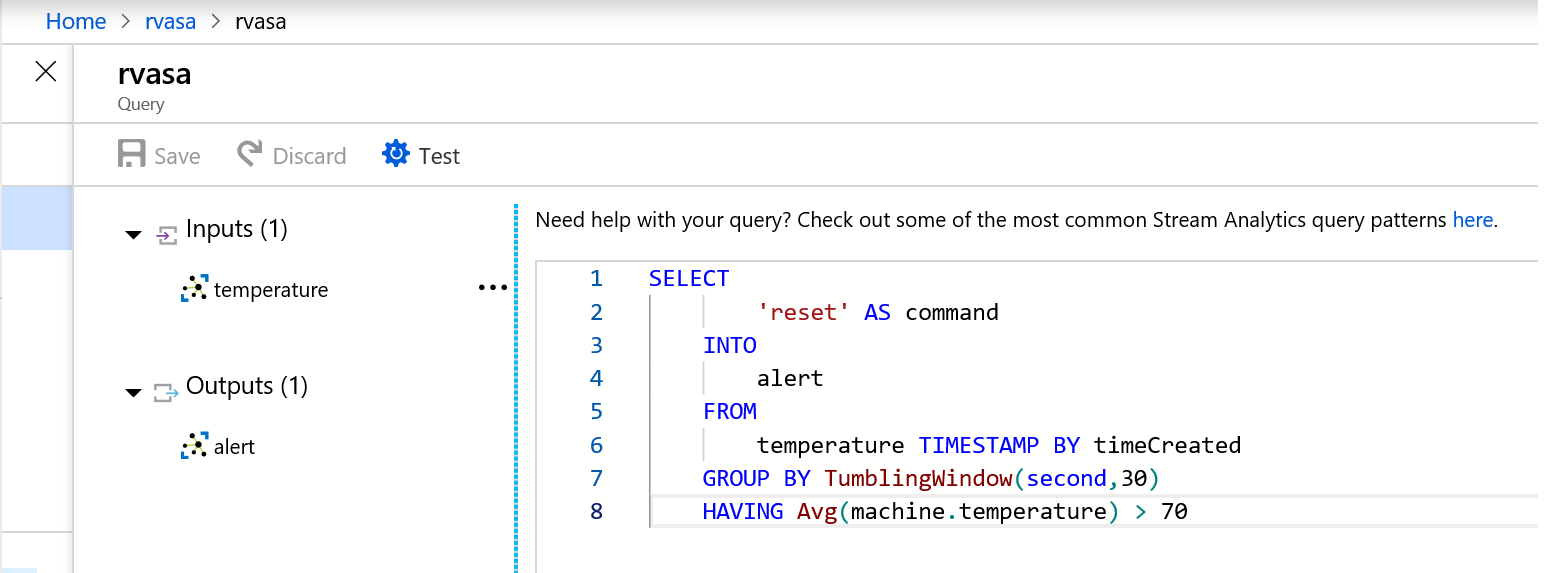
In the Stream Analytics Job blade left hand nav area, under Job topology, click Query.
This will display the Query pane with a default query.
-
In the Query pane, replace the default query with the following:
SELECT 'reset' AS command INTO alert FROM temperature TIMESTAMP BY timeCreated GROUP BY TumblingWindow(second,30) HAVING Avg(machine.temperature) > 70 -
At the top of the Query pane, in the toolbar, click Save and (if prompted) click Yes.
Configure IoT Edge Settings
To prepare your Stream Analytics job to be deployed on an IoT Edge device, you need to associate the job with a container in a storage account. When you go to deploy your job, the job definition is exported to the storage container.
-
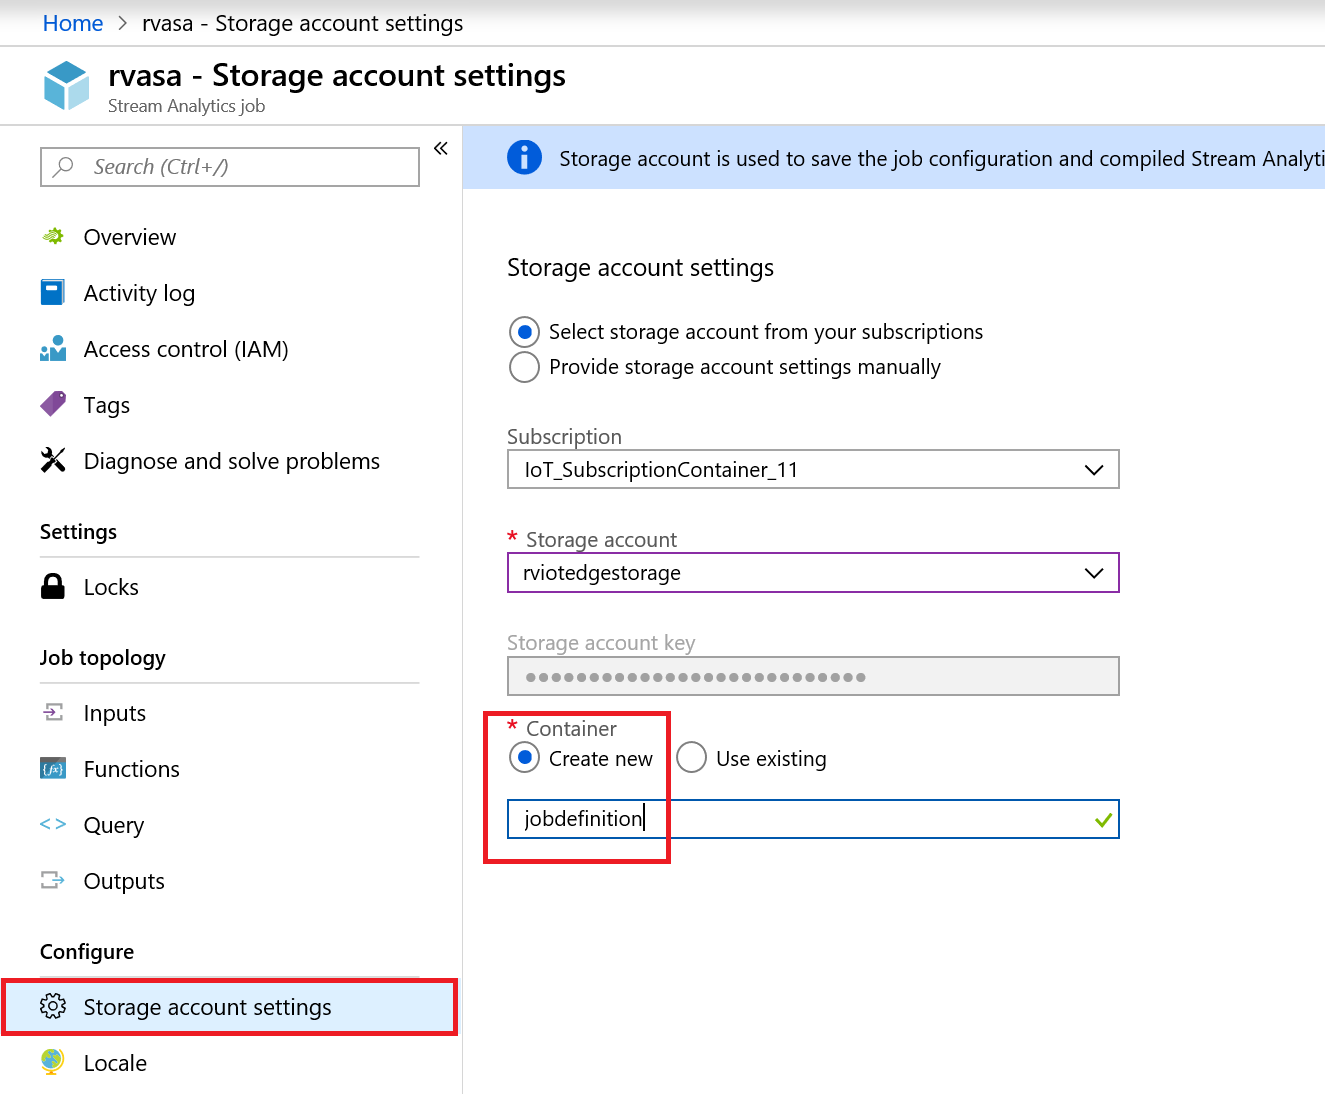
On the Stream Analytics job blade in the left hand nav area, under Configure, click Storage account settings.
-
On the Storage account settings pane, click Add storage account.
-
Select Select storage account from your subscriptions.
-
Under Subscriptions, select the subscription you wish to use.
-
Under Storage account, select the storage account you wish to use.
-
Under Container, select Create new and enter jobdefinition.
-
At the bottom of the Storage account settings pane, click Save.
Deploy the Job
You are now ready to deploy the Azure Stream Analytics job on your IoT Edge device.
For this task, you deploy two modules. The first is the tempsensor module we used in earlier tasks and is a module that simulates a temperature and humidity sensor. The second is your Stream Analytics job. The sensor module provides the stream of data that your job query will analyze.
-
In a browser, open the Azure Portal https://portal.azure.com.
Login using your Azure Subscription if required.
-
In the Search resources, services, and docs, enter the name of the IoT Hub you created earlier, and then select it from the displayed list.
The IoT Hub blade will open, displaying the Overview pane.
-
In the left hand nav pane of the IoT Hub blade, under Automatic Device Management, click IoT Edge.
-
In the list of IoT Edge devices, select your device.
The Device Details pane will be displayed. At the bottom of this pane you will see the list of deployed modules. At this point in the lab you should see 4 listed.
-
On the Device Details pane, in the toolbar, click Set modules.
The Set modules pane will display. This wizard will allow us to modify the list of modules that are deployed to the edge device and configure the data routes.
We are now going to add the Analytics Module.
-
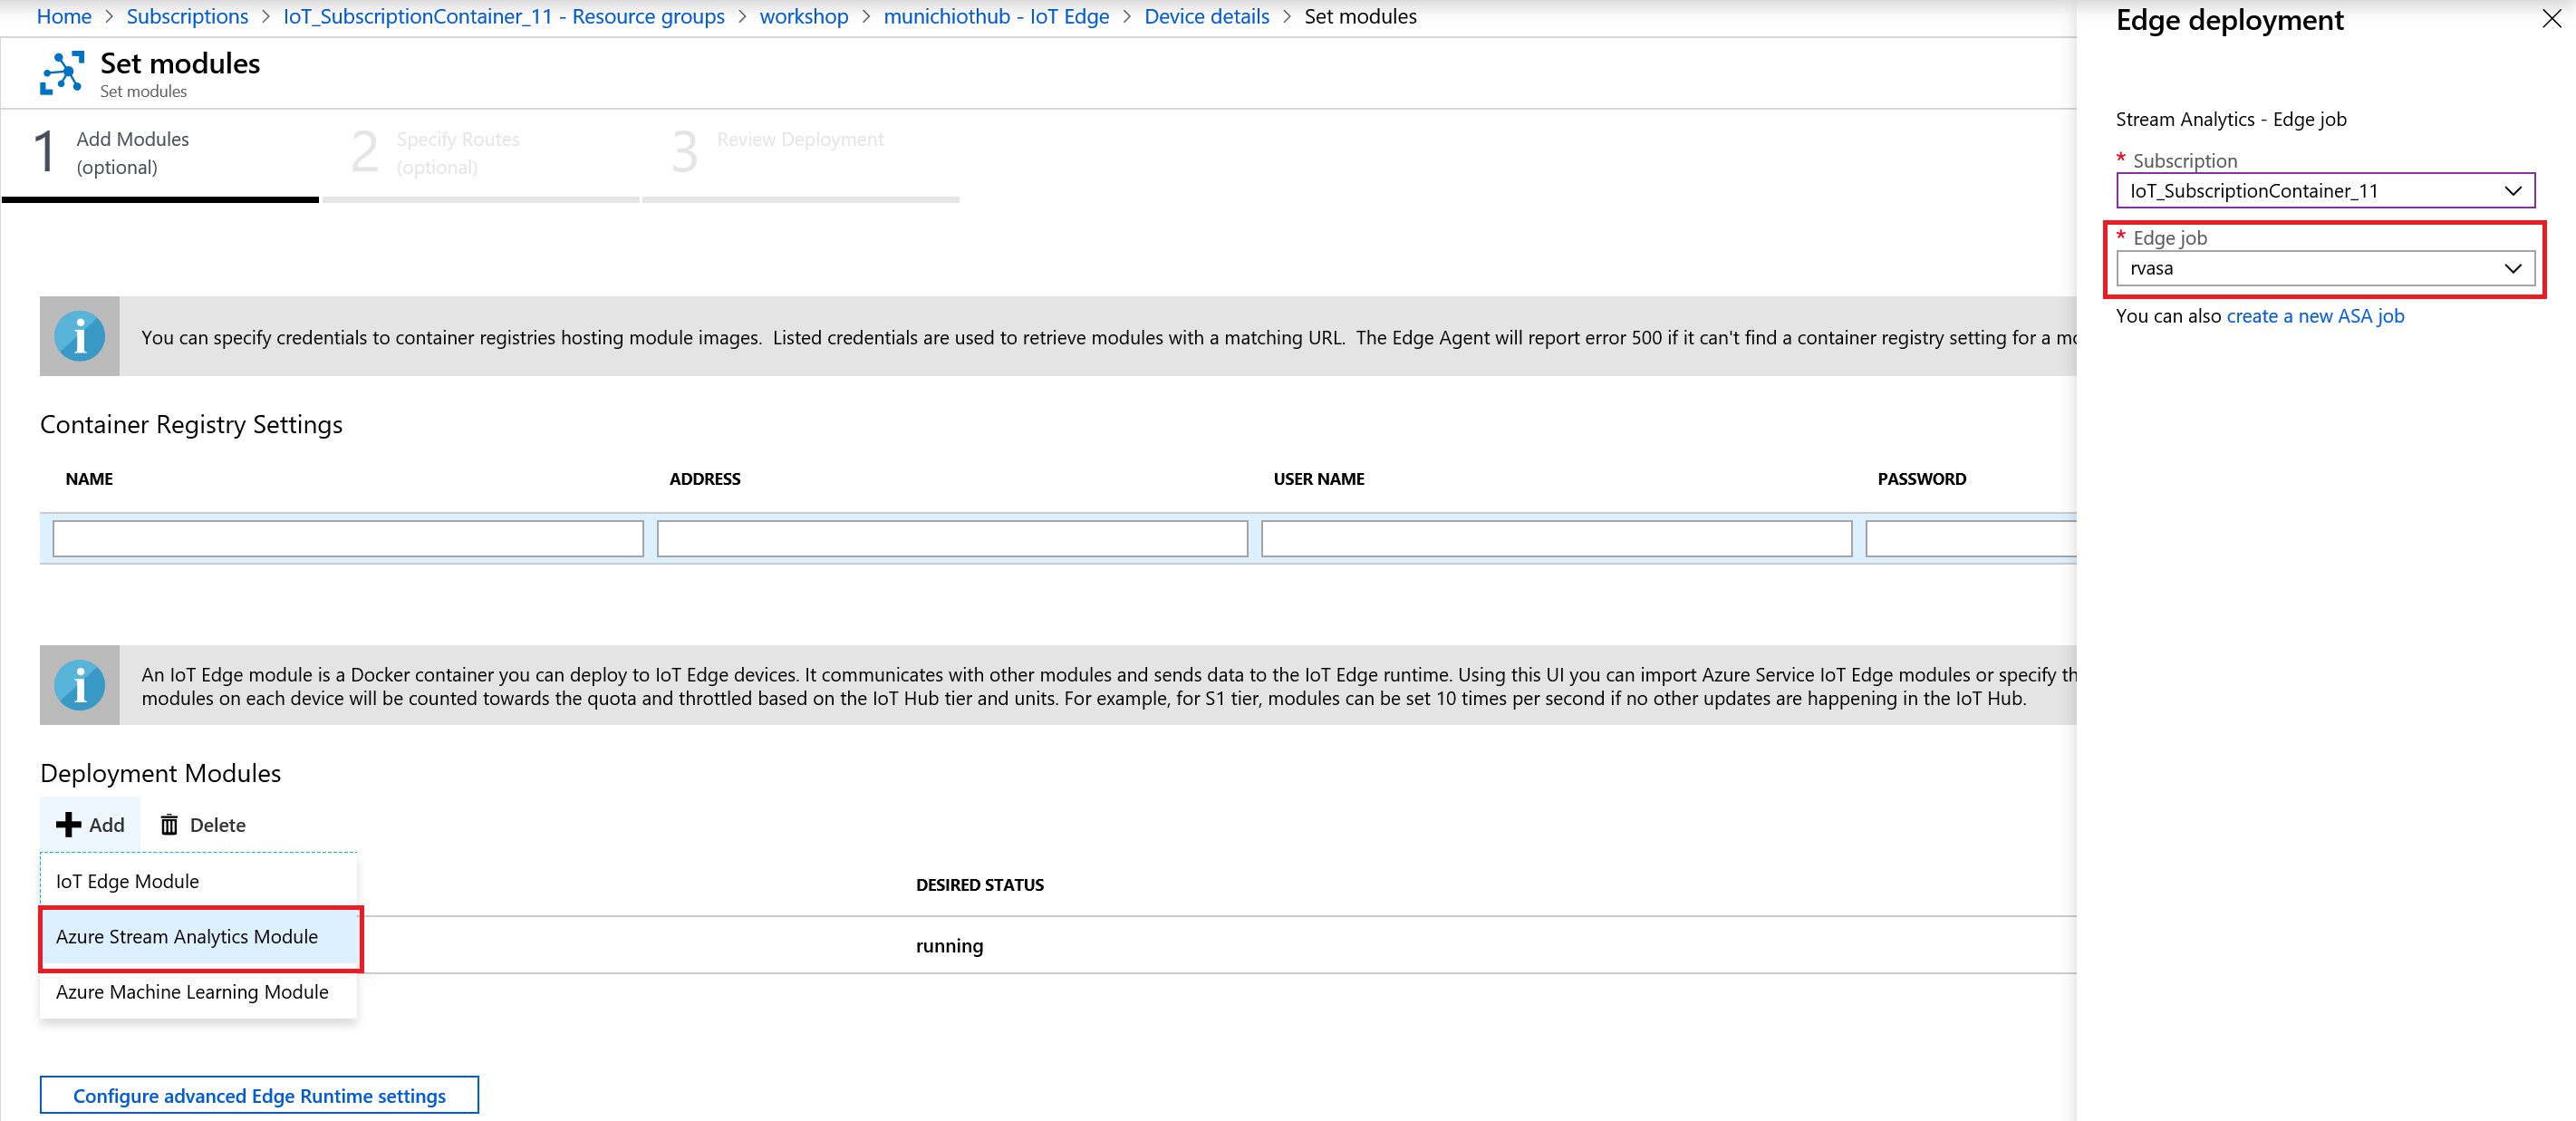
Under Deployment Modules, click Add and select Azure Stream Analytics Module from the displayed list.
The Edge deployment popup will be displayed.
-
On the Edge deployment popup, under Subscription, choose the subscription you wish to use.
-
Under Edge job, choose StreamAnalyticsJob.
-
At the bottom of the Edge deployment pane, click Save.
A notification will inform you that the edge package is being deployed. The Edge deployment popup will close and, once the deployment is complete, the list of Deployment modules will update and show the 3 modules running.
-
In the Deployment Modules list, click StreamAnalyticsJob.
This will open the IoT Edge Custom Modules popup and you can see how a Stream Analytics module is structured.
The Image URI points to a standard Azure Stream Analytics image. This is the same image used for every job that gets deployed to an IoT Edge device.
-
At the bottom of the IoT Edge Custom Modules popup, click Save.
The popup will close and we will return to the Add Modules step of Set Modules.
We now need to update the routing for the IoT Edge device.
-
At the bottom of the Set Modules pane, click Next.
The Specify Routes step will now display. You will see the existing routes:
{
 "routes": {
    "route": "FROM /messages/* INTO $upstream"
    }
}
Replace this routing definition with the following:
{
"routes": {
    "telemetryToCloud": "FROM /messages/modules/tempsensor/* INTO $upstream",
    "alertsToCloud": "FROM /messages/modules/rvasa/* INTO $upstream",
    "alertsToReset": "FROM /messages/modules/rvasa/* INTO BrokeredEndpoint(\"/modules/tempsensor/inputs/control\")",
    "telemetryToAsa": "FROM /messages/modules/tempsensor/* INTO BrokeredEndpoint(\"/modules/rvasa/inputs/temperature\")"
    }
}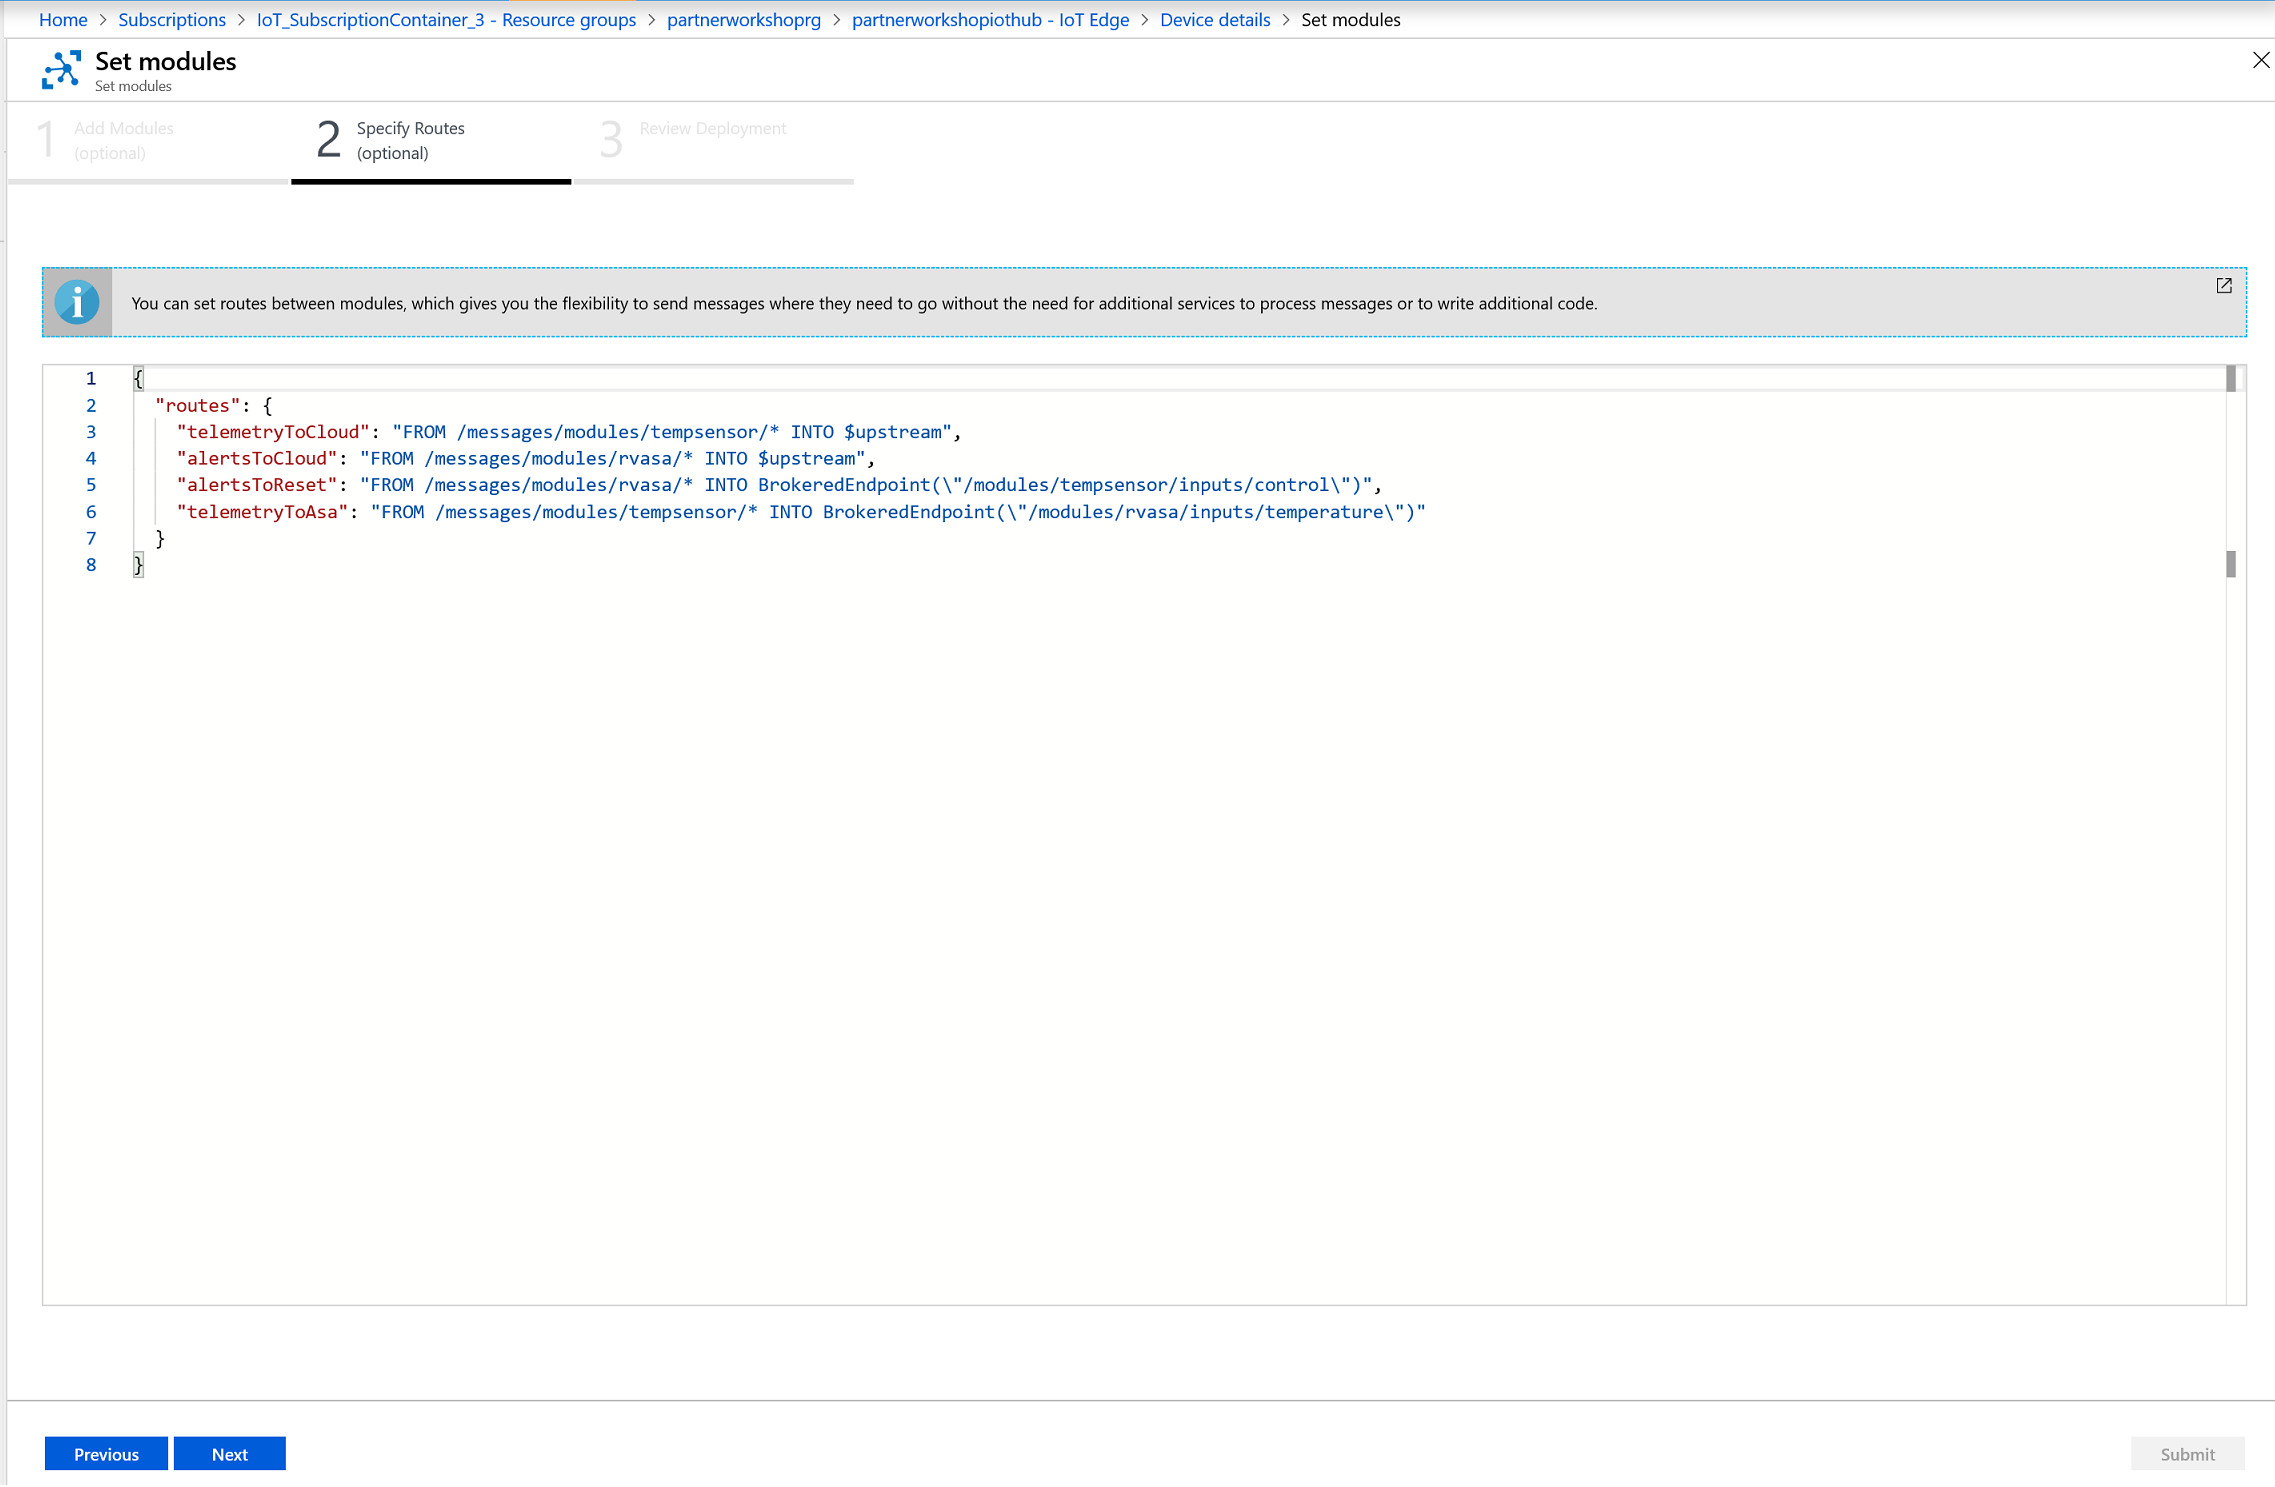
The routes that you declare here define the flow of data through the IoT Edge device. The telemetry data from tempsensor are sent to IoT Hub and to the temperature input that was configured in the Stream Analytics job. The alert output messages are sent to IoT Hub and to the tempsensor module to trigger the reset command.
-
At the bottom of the Specify Routes step, click Next.
The Review Deployment step is displayed. If you review the JSON you will see the routes we just added as well as the Stream Analytics Job module definition. In this example the StreamAnalyticsJob name is rvasa.
-
At the bottom of the Review Deployment step, click Submit (it is on the far right).
The Set Modules pane closes and returns to the Device details pane. The Modules list should be updated to include the rvasa module
In the Device details pane toolbar, click Refresh and the values should update to indicate the module has been deployed and is running.
View Data
-
In the cloud shell, enter the following command:
iotedge listThis will list the running modules:

You can see that the StreamAnalyticsJob is listed as running.
-
Enter the following command:
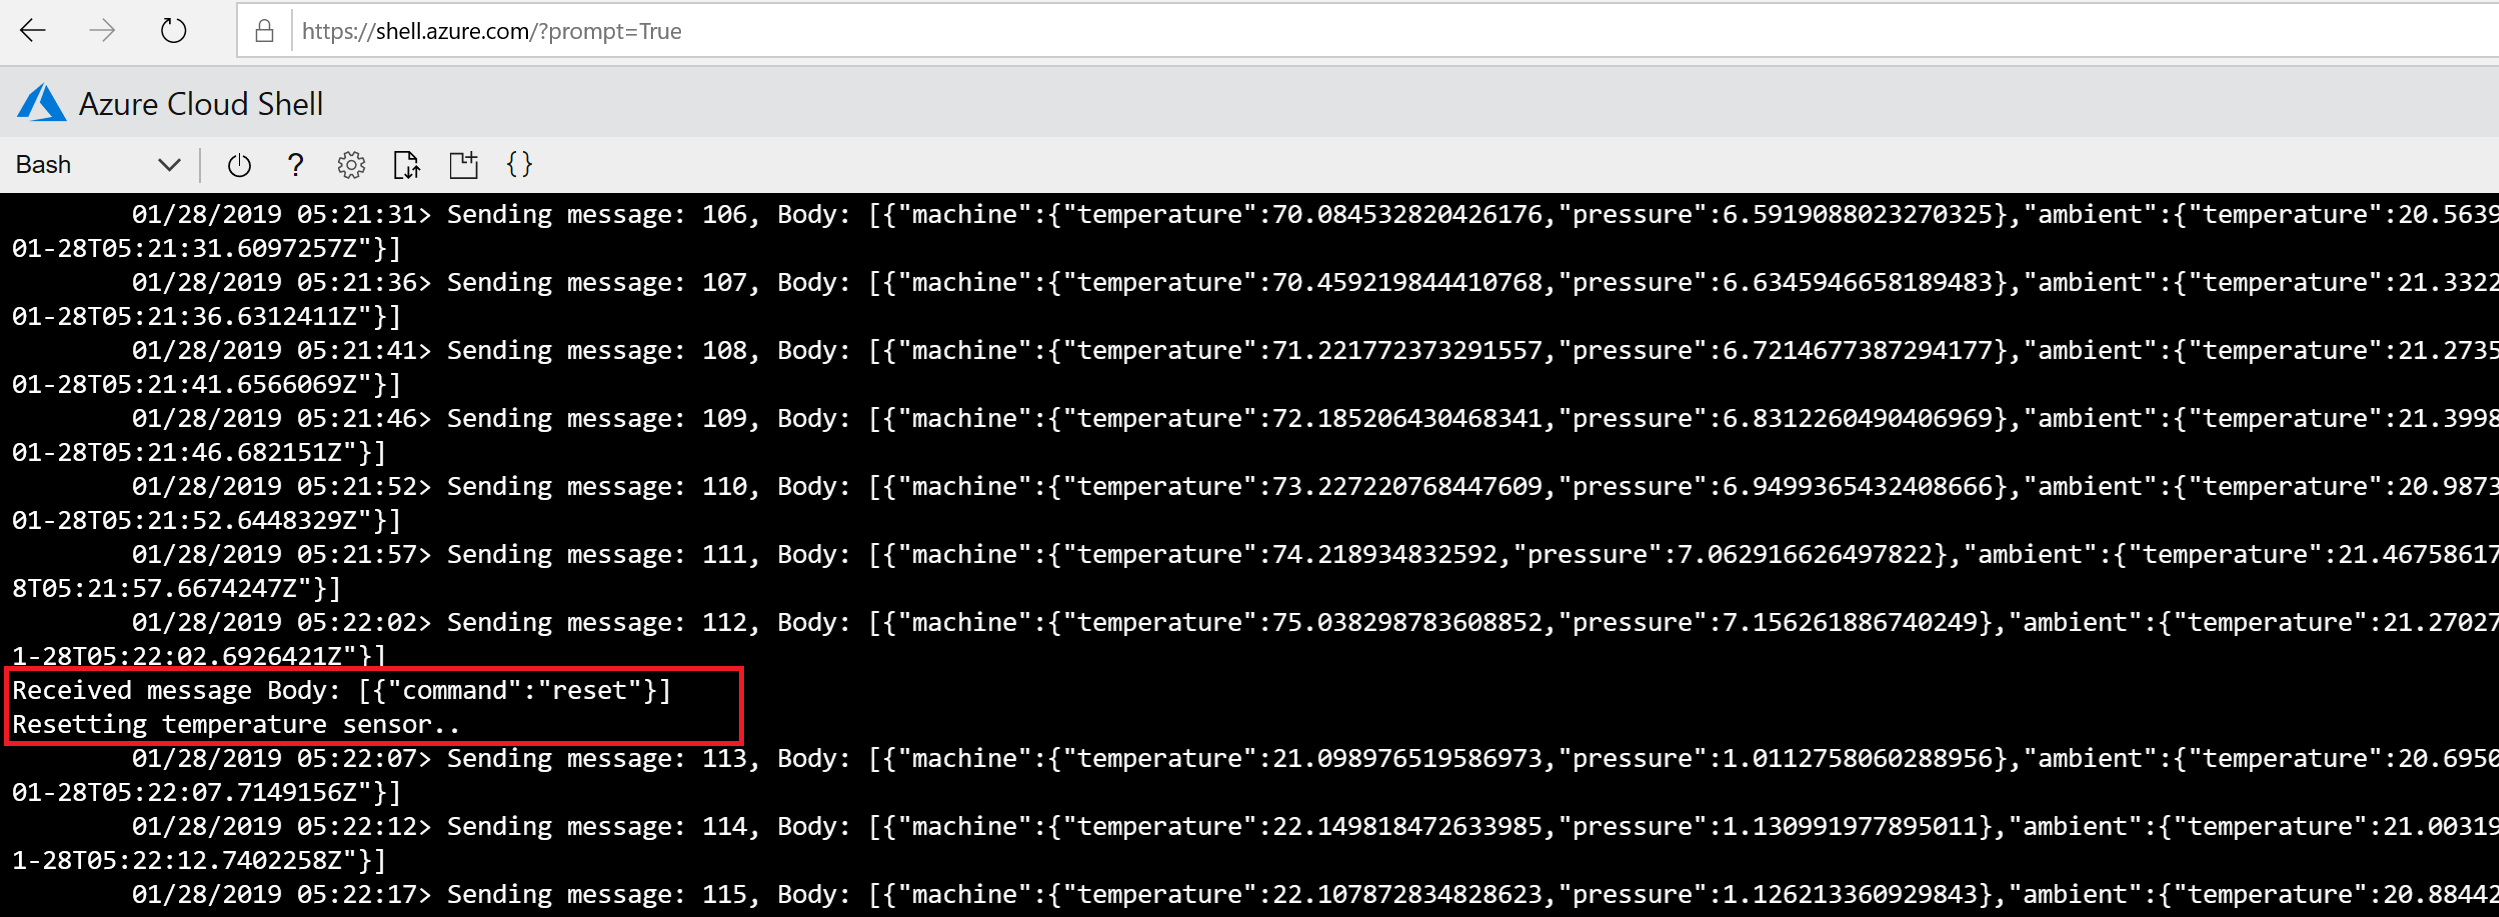
iotedge logs -f tempsensorYou will be able to watch the temperature telemetry being sent by tempsensor. if you pay attention to the
[{"machine":{"temperature": 45.123456789}}]value you will see it increment with each message. Once the value exceeds 70 (with some processing time for the ASA job to run), then the reset command will be sent by the ASA job.After the message has been received, you can see the temperature resets and starts to rise again.
Note: If you see a list of messages followed by the text
500 messages sentit means that the tempsensor module is no longer sending messages. In order to restart sending messages, enter the following command:iotedge restart tempsensorAs the command suggest, this will restart the tempsensor module so that messages are sent again.
